
Most galleries run on curator instinct. A show feels right, the flow seems good, visitors look engaged. But watch what happens when two experienced curators disagree about hanging height or room sequence - suddenly "feeling" doesn't cut it. The art world has dodged measurement for decades, treating metrics like they're somehow toxic to creative vision. Meanwhile, the galleries actually growing their visitor base and sales? They're not refusing to look at numbers.
The disconnect hits you during post-exhibition reviews. Without real data, these meetings turn into opinion wars. The curator thinks the show was transformative. The director saw empty rooms on weekdays. Sales team points to weak purchases. Everyone's right from their narrow view, and nothing improves for next time.
What separates thriving galleries from struggling ones isn't artistic vision - it's treating each curatorial decision as something you can test. Not in some soul-crushing corporate way, but as a framework for understanding what connects with your actual audience.
The Hypothesis Framework: Structure Without Sacrificing Vision
Galleries currently make decisions in a vacuum. Curator selects works based on theme, arranges them following artistic logic, writes wall text explaining their vision. Then everyone waits to see what happens. Some shows work, others flop, but nobody can explain why beyond vague hand-waving about "timing" or "market conditions."
A hypothesis-driven approach flips this passive hoping into active learning. Before hanging anything, you articulate what you expect and why. Not just "this will succeed" but specific, measurable predictions tied to specific choices.
Room flow, for instance. Traditional curation might arrange works chronologically or thematically. The hypothesis approach asks: if we place the most challenging piece third in the sequence rather than last, will visitors spend more total time here? You're not changing the art or compromising vision - you're being deliberate about testing whether your assumptions about viewer behavior actually hold up.
This extends to every curatorial choice. Lighting intensity becomes a hypothesis about emotional response and purchase likelihood. Wall text length tests whether context increases engagement or kills it. Even opening night format - formal reception versus casual gathering - becomes data about who your real audience is versus who you think they are.
Failed hypotheses teach you as much as successful ones. When that experimental projection room you were convinced would be transformative sits empty, you've learned something concrete about your audience's comfort with new media. That knowledge shapes future decisions based on reality, not wishful thinking.
Gallery Curation Metrics That Actually Matter
The art world's metric resistance often stems from measuring the wrong things. Counting bodies through the door tells you almost nothing about whether your curation works. A gallery can be packed with Instagram tourists who spend thirty seconds per room and never return.
Never miss a key exhibition detail again.
Artioly helps you organize, promote, and manage every exhibition effortlessly.
- Unified exhibition scheduling
- Artist and visitor notifications
- Inventory and sales tracking
No credit card required
Start with dwell time, but measure it right. Overall gallery time is nearly useless - you need room-by-room, piece-by-piece data. A simple manual observation system works: staff or volunteers with clipboards tracking how long visitors spend with specific works. Do this for a week during different times and patterns emerge that shatter assumptions about your strongest pieces.
What typically gets discovered: the work everyone loves on social media often has the shortest dwell time in person. That "difficult" piece tucked in the back corner? Sometimes people spend twenty minutes there. This isn't random - it reveals gaps between curatorial intent and visitor experience.
Conversion metrics need more nuance than simple sales numbers. Track the pathway from entry to inquiry to purchase, but also measure softer conversions: newsletter signups, social media follows, return visits. A visitor who doesn't buy today but returns for three straight exhibitions beats a one-time purchaser.
Survey data sounds basic but most galleries mess it up. Asking "did you enjoy the exhibition?" generates useless platitudes. Try forced rankings instead: "Order these five pieces from most to least memorable." Or behavior predictions: "How likely are you to describe this specific work to someone this week?" These questions reveal what actually stuck versus what people think they should say they liked.
Movement patterns through the space tell stories. Where do people pause? Where do they speed up? Do they follow your intended path or make their own? One gallery discovered visitors consistently walked backwards through exhibitions, starting at what curators considered the conclusion. Instead of fighting this, they redesigned narrative flow to work in reverse.
The A/B Testing Reality: Small Experiments, Big Insights
A/B testing in galleries doesn't mean turning art into focus groups. It means systematically testing specific variables while keeping everything else constant. Choose tests that challenge basic assumptions about how curation works.
Label positioning offers a perfect entry point. Most galleries default to standard height and location, but what if that's wrong for your audience? Test placing labels at different heights for two weeks each. Track not just preference but behavior - do lower labels increase or decrease actual reading? One gallery found chest-height labels increased engagement by roughly 40% for their primarily older audience, while another discovered their younger visitors preferred labels accessible via QR codes.
The most revealing tests often involve presentation hierarchy. Take two similar exhibitions and reverse the prominent placement of emerging versus established artists. Not swapping quality, just position - established artists in smaller rooms, emerging artists in the main gallery. Results usually surprise everyone. Sometimes unknown work benefits from premier placement, sometimes it doesn't, but you'll never know without testing.
Even lighting becomes testable. Run the same exhibition with dramatic spotlighting for two weeks, then switch to even, bright illumination. Track everything: time spent, photos taken, inquiries generated. Galleries often discover their audience actually prefers less dramatic lighting than curators assume, leading to both energy savings and increased engagement.
Wall color tests reveal how environment shapes perception. The same photographs shown against white walls versus grey walls generate measurably different responses - not just aesthetic preference but willingness to purchase. One gallery tested five different background colors over six months and found deep blue increased both dwell time and sales for contemporary work while destroying engagement with classical pieces.
Room sequence A/B testing requires more planning but generates powerful insights. Display the same works in chronological order for one month, thematic grouping the next. Or test starting with your strongest piece versus building toward it. Conventional wisdom about "saving the best for last" often proves completely wrong - many audiences engage more when hooked immediately.
Measurement Infrastructure Without Museum Budgets
Small galleries assume meaningful measurement requires expensive technology. Museum-grade tracking systems, heat mapping cameras, advanced analytics platforms. This perfectionist paralysis keeps galleries from gathering any data, perpetuating the cycle of guess-based curation.
Start with clipboards and volunteers. A simple observation protocol where someone records entry time, path taken, and exit time for every tenth visitor gives you more insight than most galleries currently have. Add basic behavior notes - did they read labels, take photos, speak to others - and patterns emerge within days.
Free tools handle most digital measurement needs. Google Forms for exit surveys, basic website analytics for online engagement, social media insights for content performance. You don't need sophisticated integration - just consistent data collection and regular review.
The biggest infrastructure investment should be establishing measurement habits, not buying technology. Pick three metrics that matter for your gallery's specific goals.
| Metric |
|---|
| average dwell time |
| repeat visit rate |
| social media mentions |
Maybe it's average dwell time, repeat visit rate, and social media mentions. Track these for six months before adding complexity.
For position tracking, colored stickers work better than expensive systems.
Give entering visitors a specific color dot for that day. Ask them to place it next to their favorite work before leaving. After a week, you have a heat map of preference that cost twenty dollars in stickers.
iPad surveys at exit generate higher response rates than email follow-ups, but even a QR code leading to a mobile-friendly form beats nothing. Making participation feel valuable, not obligatory matters. "Help us understand what resonated" works better than "please complete our survey."
Manual counting still has its place. One person with a counter tracking entries to specific rooms answers the basic question of where people actually go. Combine this with security camera review (which you're already recording) and you can map movement without installing new systems.
Building Your Review Cadence: From Opening Night to Next Exhibition
The standard gallery review process - if it exists - happens once per exhibition. A post-mortem where everyone shares feelings about what worked. This reactive approach guarantees repeating the same mistakes while missing opportunities to adjust mid-stream.
Effective review cadence starts before opening night. Document your hypotheses: what you expect to happen and why. Include specific predictions about which pieces will draw attention, how visitors will move through space, what questions they'll ask. This pre-opening documentation becomes your baseline for learning, not justification.
-
Document your hypotheses
what you expect to happen and why. Include specific predictions about which pieces will draw attention, how visitors will move through space, what questions they'll ask.
-
The 48-hour review catches immediate reactions while they're fresh. What surprised you opening night? Which conversations happened that you didn't expect? What technical issues emerged - lighting, flow, labels?
-
Weekly reviews during the run enable real-time adjustments. Maybe you notice people missing a crucial piece because of poor sightlines. Move it. Visitors consistently asking the same question? Add clarifying text.
-
The mid-run deep dive, typically at three or four weeks, examines accumulated data. Compare your initial hypotheses to actual metrics. Review survey responses for patterns. Analyze sales data not just for volume but timing and buyer profiles.
-
End-of-exhibition analysis goes beyond success metrics to examine process. Which curatorial decisions had the intended effect? Where did visitor behavior diverge from expectation?
A simple visual of the review cadence workflow.
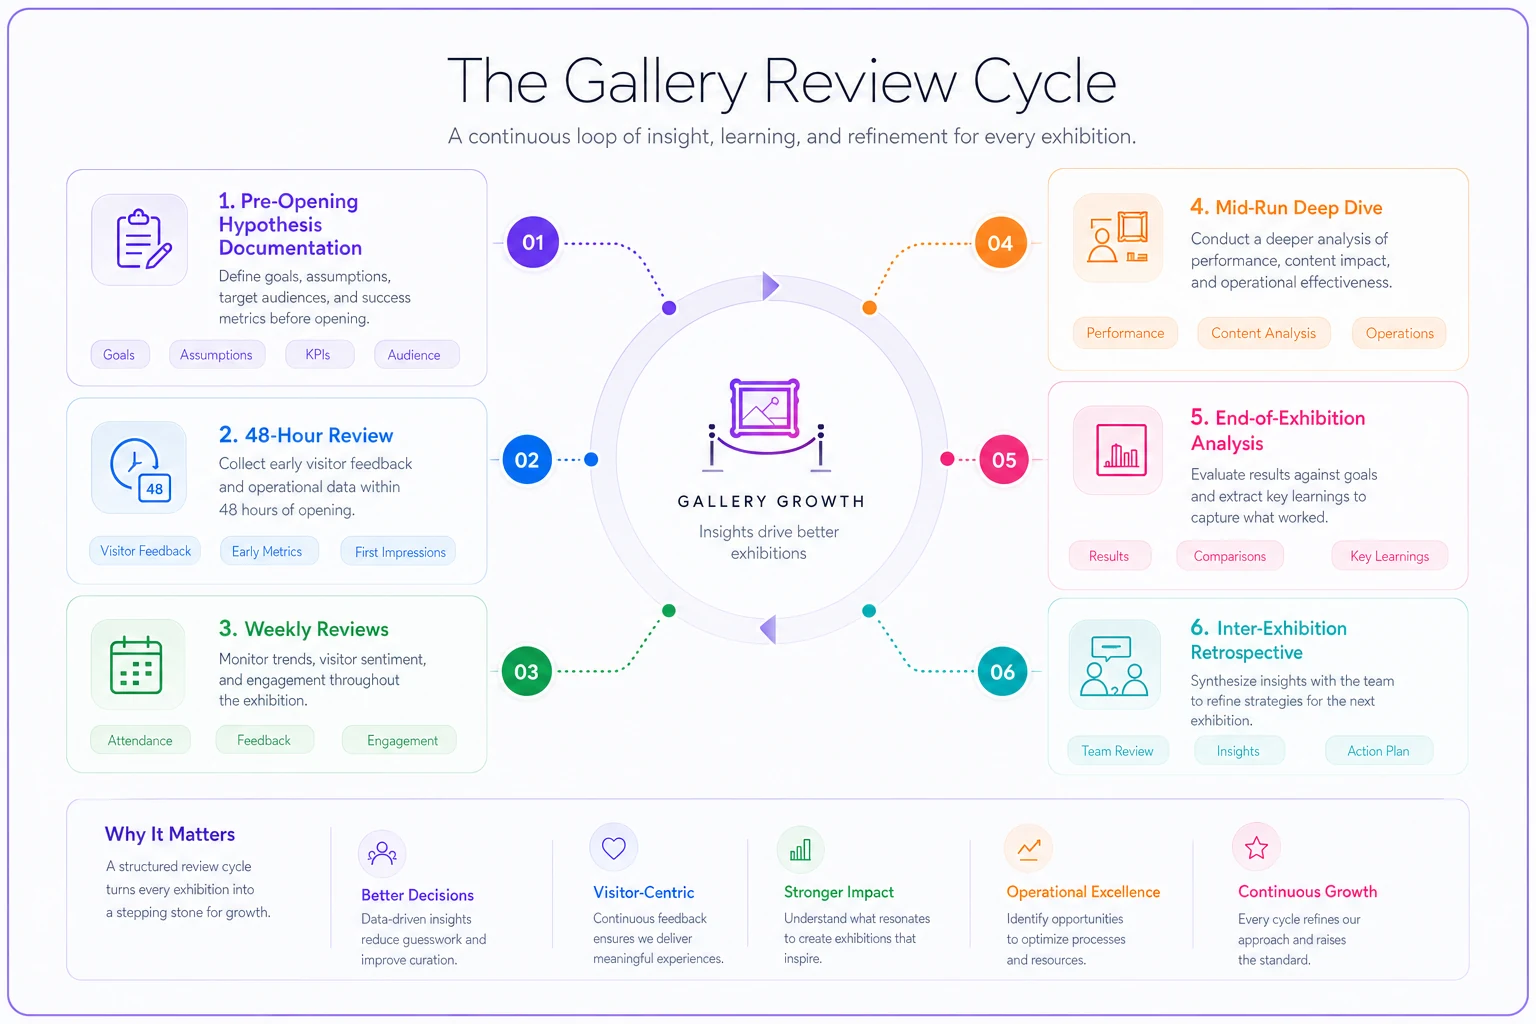
Most galleries miss the inter-exhibition review. Three months after an exhibition closes, revisit its data with fresh eyes. Often patterns only become visible in retrospect, especially when compared across multiple shows. That challenging piece that seemed to fail? Maybe it drove record social sharing that converted to attendance at your next opening.
When Metrics and Vision Collide: Navigating the Tension
Sometimes the data will tell you people prefer the mediocre work. The challenging piece you're proudest of displaying might generate terrible metrics across every dimension. This is where hypothesis-driven curation proves its value - not by forcing you to follow the numbers, but by making you articulate why you're choosing not to.
The balance comes from understanding what different metrics actually measure. Low dwell time doesn't automatically mean failure - maybe the work delivers its impact instantly. Poor sales don't negate cultural value. But if you're consistently curating exhibitions that your actual audience doesn't connect with, at some point you need to question whether you're serving your mission or your ego.
Smart galleries use metrics to set boundaries, not make decisions. If visitor engagement drops below a certain threshold, that triggers a review, not an automatic change. If sales can't sustain operations, that's a constraint to work within, not a mandate to show only commercial work. The data informs but doesn't dictate.
Some galleries establish "mission metrics" alongside commercial ones. Track sales and attendance, but also measure educational impact, artist development, community engagement. When the provocative exhibition that challenged your audience scores low on immediate satisfaction but high on discussion generation, you can defend that trade-off with evidence.
Transparency about when you're choosing vision over metrics matters. Document these decisions as explicitly as you document the data itself. "We're keeping this piece in the prime spot despite low engagement because..." This clarity helps distinguish between principled curatorial choices and stubborn attachment to failed ideas.
The Feedback Loop That Changes Everything
Galleries seeing dramatic improvement aren't just collecting data - they're creating systematic feedback loops that connect visitor behavior to future curatorial decisions. This isn't about becoming market-driven or populist. It's about understanding the gap between intention and reception so you can either bridge it or make informed choices to maintain it.
When galleries implement even basic feedback loops, things change fast. That experimental video installation everyone internally debated? The data shows it drew younger visitors who stayed twice as long as usual. Now you have evidence to support or challenge similar future risks. The traditional hang everyone assumed worked perfectly? Turns out people consistently miss the corner pieces. Small adjustment, major impact.
The operational transformation extends beyond individual exhibitions. Patterns emerge across shows that reshape basic gallery assumptions. Maybe Sunday afternoons aren't your dead time - they're when serious collectors browse quietly. Or that education programming you've been forcing actually drives away your core audience while failing to attract new visitors.
Most importantly, hypothesis-driven curation creates institutional learning that survives staff changes. When decisions and results are documented systematically, new curators inherit knowledge, not just tradition. They understand why certain approaches failed, what's been tested, what remains unknown. The gallery's curatorial intelligence accumulates rather than resets with each new hire.
Galleries resisting this approach usually share the same fear: that measurement will stifle creativity. Yet the opposite occurs. When you know what actually happens versus what you hope happens, you can take bigger risks. You can defend unconventional choices with evidence. You can spot unexpected successes that tradition would have missed.
Making It Actually Work: Beyond Theory
The transition from instinct-based to hypothesis-driven curation doesn't happen overnight. Start with one exhibition, pick three specific decisions to test, measure them simply but consistently. Maybe it's label length, lighting style, and opening format. Document predictions, track results, review honestly.
The resistance you'll encounter won't be philosophical - it'll be operational. Who has time to observe visitors when you're understaffed? How do you analyze data without dedicated personnel? This is where most galleries give up, returning to comfortable intuition.
The solution isn't perfection but consistency. Better to track three things reliably than attempt comprehensive measurement that collapses after two weeks. Build measurement into existing workflows rather than adding new ones. If someone's already in the gallery, give them a simple observation task. If you're writing labels anyway, create two versions to test.
Your gallery's specific metrics will differ from everyone else's. A contemporary art space might prioritize social media engagement and repeat visits. A traditional gallery might focus on sales conversion and collector development. A community-focused space might measure educational impact and local attendance. The framework remains constant - hypothesize, measure, review, adjust - but the metrics reflect your mission.
Modern galleries can benefit from AI-powered operational software that helps track visitor patterns, manage feedback collection, and automate routine measurement tasks. These platforms can centralize exhibition data, visitor surveys, and performance metrics in one place, making it easier to spot patterns across multiple shows without drowning in spreadsheets. The technology handles the data collection mechanics, freeing curators to focus on interpreting insights and making informed decisions.
The galleries thriving five years from now won't be the ones with the best intuition or most prestigious artists. They'll be the ones that learned fastest from each exhibition, building systematic knowledge about what actually works for their specific audience in their specific context. Not through abandoning curatorial vision, but by testing it against reality and adapting based on evidence rather than ego.
This isn't about making art scientific. It's about making galleries sustainable by understanding the complex relationship between curatorial decisions and audience response. In an environment where every exhibition is a financial risk and cultural statement, can you really afford not to know what actually happens when vision meets visitor?
Ready to elevate your gallery operations?
Join 500+ galleries using Artioly to streamline operations, boost visitor engagement, and increase art sales.