



Most gallery budgets fall apart in the same spot: the gap between what you committed to and what actually left the bank account. A framer's quote gets verbally agreed, a shipping invoice comes in 18% over estimate, an artist asks for a last-minute vinyl wall text, and suddenly the show that penciled out at a modest surplus is sitting at a loss you don't notice until install is already up.
This post walks through a downloadable Excel / Google Sheets workbook built specifically to catch that drift. It's not a generic budget sheet — it's structured around the one decision that actually protects your cash: the go/no‑go call. Everything in the file, the line items, the deposit schedule, the weekly cashflow calendar, the break-even calculator, feeds a set of decision-gate flags that tell you in plain language whether to proceed, renegotiate, or walk.
If you want the deeper reasoning behind the financial model itself, the exhibition financial model and break-even playbook covers the theory. This article is the hands-on companion: how to populate the file, what each tab does, and how to read the three annotated sample shows that ship with it.
What's inside the workbook
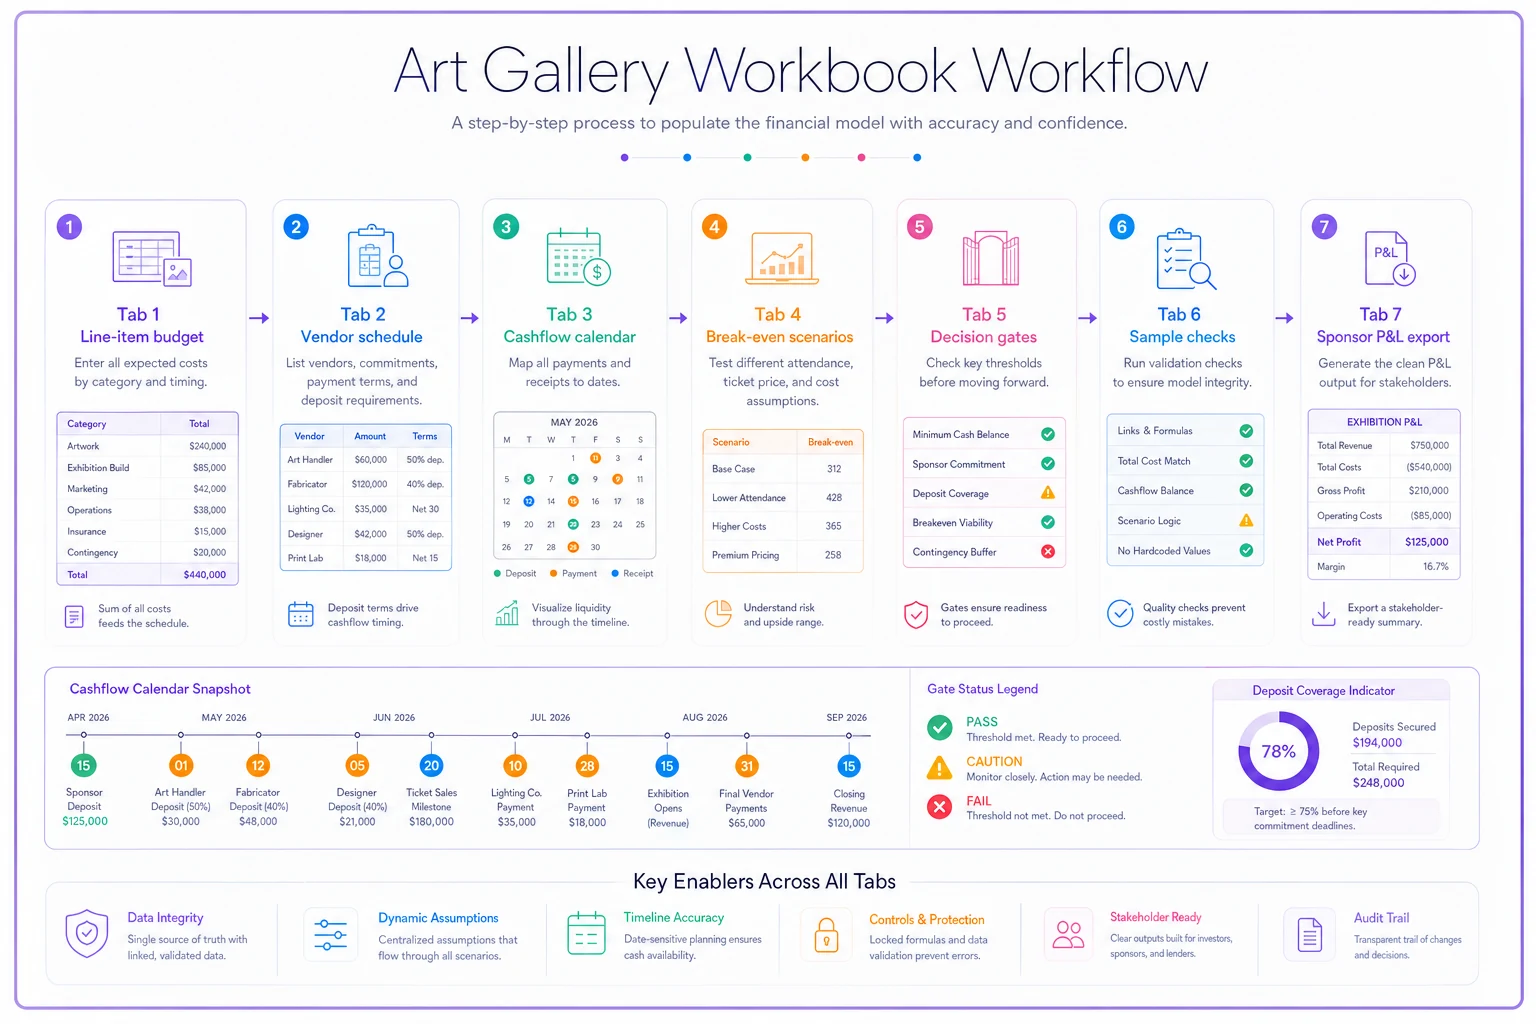
The file has seven working tabs plus a printable checklist. Here's the layout before we get into the how-to.
| Tab | What it does | Who touches it |
|---|---|---|
| 1. Line-item budget | Committed / estimated / actual columns per cost line | Manager + bookkeeper |
| 2. Vendor schedule | Deposits, balances, due dates per vendor | Manager |
| 3. Cashflow calendar | Week-by-week inflow/outflow + running balance | Manager |
| 4. Break-even calculator | Attendance / sponsorship / retail scenarios | Director |
| 5. Decision gates | Automated flags that read tabs 1–4 | Everyone (read-only) |
| 6. Sample shows | Three annotated examples (low/mid/high risk) | Reference only |
| 7. Sponsor P&L extract | Clean, external-facing summary | Director |
| Checklist (print) | Contract milestones for go/no‑go meetings | Director + board |
One thing worth understanding before you open it: the three money tabs — budget, vendor schedule, cashflow — are the inputs. The decision-gate tab is the output. You don't edit the gates; they change color and text on their own based on what you type into the first three tabs. That separation is deliberate. The person entering invoices shouldn't also be the person deciding whether the numbers look scary.
The committed / estimated / actual distinction (and why it's the whole point)
Most gallery budgets run two columns: "budget" and "actual." That's the structural flaw that lets shows drift. The problem is "budget" quietly mixes two completely different kinds of numbers — things you've actually agreed to pay and things you're guessing at.
Never miss a key exhibition detail again.
Artioly helps you organize, promote, and manage every exhibition effortlessly.
- Unified exhibition scheduling
- Artist and visitor notifications
- Inventory and sales tracking
No credit card required
-
Committed — a signed quote, a countersigned contract, a confirmed shipping rate. Money you are legally or practically on the hook for.
-
Estimated — your best guess with no commitment yet. Framing you haven't quoted, a catering headcount you haven't locked.
-
Actual — what cleared the account.
Why this matters: the risk in a show isn't the committed money — you already know that number. The risk lives in the gap between estimated and actual. A typical mid-size show might have around $4,200 committed and $6,800 estimated. The committed portion is predictable. The $6,800 is where a show goes from a $900 surplus to a $1,500 loss, because estimates skew optimistic — install labor runs long, the shipping crate needs custom bracing, the opening-night bar tab doubles.
The sheet calculates an exposure number automatically: estimated minus actual on every line that isn't yet settled. That single figure is your "how much can still surprise me" amount. When exposure climbs above a threshold you set (the default is 40% of total budget), the decision gate flags it.
How to populate the file, step by step
Don't try to fill in all seven tabs at once. There's an order, and skipping it creates circular confusion where the cashflow calendar references vendor dates that don't exist yet.
-
Start with the line-item budget (Tab 1). Enter every cost category you can think of, even ones at $0 for now. Use the committed/estimated/actual columns honestly — if you don't have a signed quote, it goes in estimated, not committed. Resist the urge to pad estimates "to be safe." Padding just hides the real exposure.
-
Build the vendor schedule (Tab 2). For each vendor with a deposit, enter the deposit amount, the balance, the deposit due date, and the balance due date. This tab is what turns abstract costs into dated cash obligations. A framer isn't "$1,100" — it's "$550 on Oct 2, $550 on Nov 14."
-
Let the cashflow calendar populate (Tab 3). The due dates from Tab 2 flow into the weekly calendar automatically. You add expected inflows manually — sponsor tranches, anticipated sales deposits, membership income allocated to the show. The running-balance column is the one to watch. If it ever goes negative, you have a timing problem even if the show is profitable overall.
-
Set your break-even scenarios (Tab 4). Enter three retail/attendance/sponsorship assumptions: conservative, expected, optimistic. The calculator shows what each scenario needs to hit break-even.
-
Read the decision-gate tab (Tab 5). Don't type anything here. Just read it. It aggregates exposure, cashflow dips, and break-even distance into go / caution / no‑go flags.
-
Only then look at the samples (Tab 6) to sanity-check your numbers against the annotated examples.
The most common population mistake is entering estimates as commitments because it feels more "decisive." It isn't — it just blinds the exposure calculation and makes the gates think you're safer than you are.
A simple visual of the step order makes it easier to keep the process sequential and avoid circular references.
The most common population mistake is entering estimates as commitments because it feels more "decisive." It isn't — it just blinds the exposure calculation and makes the gates think you're safer than you are.
Reading the three annotated sample shows
The workbook ships with three fully filled-in example shows so you're not staring at a blank grid. They're annotated — comment bubbles explain why each gate fired.
Low-risk sample ("Group show, local artists"). Total budget around $7,000, almost entirely committed, modest sponsorship, conservative retail expectations. Exposure sits near 15%. Every gate is green. The annotation points out that this show is boring on purpose — it's the kind you greenlight without a board meeting.
Mid-risk sample ("Solo show with shipping"). Budget close to $14,000. The shipping and install lines are estimated, not committed, pushing exposure to around 38%. The cashflow calendar shows a two-week dip where a vendor balance is due before the sponsor's second tranche arrives. The gate flags caution — not because the show loses money, but because of timing. The fix annotated in the sheet: ask the sponsor to move their tranche two weeks earlier, or negotiate the vendor balance to net-30.
High-risk sample ("Ambitious new-media show"). Budget around $31,000, heavy on estimated equipment rental and unconfirmed sponsorship. Exposure over 50%, break-even relies on the optimistic attendance scenario, and the cashflow goes negative in week three. Multiple no‑go flags. The annotation is blunt: this doesn't proceed until two of the three sponsorship tranches are contractually committed and the equipment quote is signed.
The lesson across all three isn't "avoid risk." It's that the same gate logic treats three very different shows fairly, and tells you which specific thing to fix rather than just flagging that something feels off.
The break-even calculator: running a sensitivity scenario
This is the tab people underuse. Break-even in a gallery isn't one number — it's a blend of attendance-driven retail, sponsorship, and direct sales. The calculator lets you flex each lever independently.
A quick sensitivity run looks like this. Say your expected scenario assumes 400 visitors, a 4% buy rate, and an average sale of $280. That's roughly $4,480 in sales. Drop the buy rate to 3% — a single percentage point — and sales fall to about $3,360. That $1,100 swing from one assumption is exactly the kind of fragility you want to see before committing.
-
Change one variable at a time (attendance, buy rate, average sale, or sponsorship).
-
Watch the "break-even gap" cell — it shows how far the scenario is from covering total cost.
-
If break-even only works in the optimistic column, treat that as a no‑go signal regardless of how exciting the show is.
Shows that only break even under optimistic assumptions almost never hit optimistic in reality. The expected column should clear break-even comfortably, or the show is riding on hope.
Importing your historical data
The sheet is more useful when your estimates are grounded in your own past shows instead of guesses. There's a hidden "History" tab for this.
You don't need clean data to start. Even three past shows pasted in roughly will catch the biggest optimism gaps.
Export your last six to ten shows from your accounting system or old budget files — actual costs per category and actual sales. Paste them into the History tab in the matching columns. The estimated columns on Tab 1 will then show a "your typical" reference number next to each line. If your historical install labor averages $1,400 and you've estimated $800 for the new show, that mismatch shows up immediately.
You don't need clean data to start. Even three past shows pasted in roughly will catch the biggest optimism gaps. The point isn't precision — it's a reality check against your own numbers.
Exporting the sponsor-facing P&L
Sponsors and board members don't need your vendor deposit dates or your internal exposure math. Tab 7 generates a clean summary that pulls only the external-facing figures: total programming cost, sponsorship contribution, projected and actual sales, and net result.
To export: fill in Tabs 1–3 as usual, then on Tab 7 hit File → Download → PDF (or print to PDF in Excel). The tab is pre-formatted to one page and deliberately hides the estimated-vs-actual internals so you're not showing a sponsor your worst-case guesses.
One thing worth doing consistently: keep a dated version each time you export. When a sponsor asks "why is the final number different from what you showed us in September," a timestamped extract settles the conversation in about ten seconds.
The printable go/no‑go checklist
The decision-gate tab tells you the financial state. The checklist makes sure the contractual milestones are met before anyone commits real money. Print it for the go/no‑go meeting.
-
[ ] Artist agreement signed, including deliverables and deadlines
-
[ ] All vendor quotes with exposure over $1,000 are committed, not estimated
-
[ ] Sponsorship
at least the first tranche is contractually confirmed
-
[ ] Cashflow calendar shows no negative running balance, OR a documented bridge
-
[ ] Break-even clears in the expected scenario, not just optimistic
-
[ ] Insurance / loan paperwork in motion for any borrowed works
-
[ ] Decision-gate tab shows no unresolved red flags
-
[ ] Named owner for every line still sitting in "estimated"
The rule worth enforcing: if any red flag on Tab 5 is still live, the meeting ends in "no‑go" or "deferred," not "let's just see." Decision gates only work if you actually honor them when they're inconvenient.
When this workbook makes sense — and when it doesn't
Use it when you're running shows with real external money on the line: sponsorship, shipping, loans, meaningful install costs. Anything where a timing mistake or an optimistic estimate can turn a surplus into a loss. It's especially useful for galleries where one person is juggling budgeting, vendor coordination, and the board update — because the automated gates handle the "is this getting dangerous" thinking so that already-stretched person doesn't have to carry it alone.
Skip it, or simplify it heavily, when your shows are tiny and self-funded. A $1,500 local group show with no deposits and no sponsor doesn't need a cashflow calendar. You'll spend more time maintaining the sheet than the risk justifies. Tab 1 alone is probably enough.
Who should not rely on it as-is: galleries with genuinely complex multi-currency international loans and customs timing. The cashflow logic assumes single-currency and won't model FX swings. You can still use the budget and gate tabs, but build currency timing separately.
A real scenario
A two-person commercial gallery was planning a solo show with international shipping. On their old two-column budget it looked fine — a projected surplus of roughly $1,200. When they rebuilt it in the committed/estimated/actual structure, the picture changed fast. About $9,000 of the $15,000 budget was still estimated, and the exposure flag fired at 60%.
The cashflow calendar then surfaced the actual problem: the shipping balance was due in early November, but the sponsor's second payment wasn't contractually dated — it was a verbal "sometime that month." The running balance dipped to roughly negative $3,400 for about ten days.
None of that had shown up in the two-column version. They didn't cancel the show. They moved the go/no‑go meeting up, got the sponsor to commit the second tranche in writing with a fixed date, and negotiated the shipper to net-30. The show ran and closed close to the original $1,200 surplus — without the ten-day cash hole that could have forced them to delay an artist payment.
The outcome wasn't that the sheet made the show profitable. The show was always roughly breakeven-plus. What it did was make the timing risk visible early enough to fix it cheaply, instead of discovering it when a payment bounced.
Getting started
Download the workbook, duplicate it for your next show, and spend the first hour only on Tab 1 — honest committed/estimated/actual columns. Don't rush to the gates. The decision-gate tab is only as smart as the honesty of what you type into the first three tabs. If you pad estimates or log guesses as commitments, the flags will reassure you right up until the money's gone.
Get the inputs right, read the gates when they turn red, and run the go/no‑go meeting with the printed checklist in hand. The spreadsheet isn't trying to predict the future — it's trying to make sure the show you say yes to is one your bank account can actually survive.
Download the workbook, duplicate it for your next show, and spend the first hour only on Tab 1 — honest committed/estimated/actual columns. Don't rush to the gates. The decision-gate tab is only as smart as the honesty of what you type into the first three tabs. If you pad estimates or log guesses as commitments, the flags will reassure you right up until the money's gone.
Get the inputs right, read the gates when they turn red, and run the go/no‑go meeting with the printed checklist in hand. The spreadsheet isn't trying to predict the future — it's trying to make sure the show you say yes to is one your bank account can actually survive.
Ready to elevate your gallery operations?
Join 500+ galleries using Artioly to streamline operations, boost visitor engagement, and increase art sales.