
Gallery exhibitions operate on razor-thin margins that most people outside the industry never fully grasp. You're basically gambling $15,000 to $45,000 every six weeks on whether enough collectors show up, whether the right press hits, and whether your artist's market holds steady long enough to recoup costs.
The brutal math works like this: a typical mid-tier gallery show costs somewhere around $22,000 to mount when you factor in everything—not just the obvious shipping and printing costs, but the hidden killers like staff overtime during install week, extra insurance riders, marketing spend that rarely converts directly, and the opportunity cost of tying up your best salesperson for three weeks straight. Meanwhile, you need to move at least four major works or twelve smaller pieces just to break even, assuming standard commission splits.
Most galleries run these calculations in their heads or across scattered spreadsheets, making go/no-go decisions based on gut feeling mixed with whatever cash happens to be available. This approach works until it doesn't—usually when you hit that third consecutive underperforming show and suddenly you're scrambling to make payroll.
The hidden cost structure that kills exhibition profitability
Every exhibition carries two distinct cost profiles that behave completely differently as you scale up or down. Fixed costs hit you regardless of whether one person or one thousand people walk through the door. Variable costs scale with attendance, sales volume, and the specific demands of each show.
Fixed costs typically run between $8,000 and $18,000 per show for a small to mid-sized gallery. This includes baseline staffing (someone has to be there Tuesday through Saturday regardless), rent allocation for the exhibition space, basic insurance, standard lighting and climate control, and core marketing spend like your monthly email platform fee and website hosting. These costs are locked in the moment you commit to a show date.
Variable costs fluctuate wildly depending on the exhibition. A photography show might only add $3,000 in variable costs—simple mounting, minimal shipping, straightforward installation. But a sculpture exhibition with international loans could push variable costs past $25,000 once you factor in custom crating, specialized art handlers, additional insurance riders, structural modifications for heavy works, and potentially hiring a structural engineer to verify your floor can handle that bronze piece.
The real killer comes from semi-variable costs that galleries rarely track properly. Opening night is the perfect example. You might budget $2,000 for wine and cheese, but if 400 people show up instead of the expected 200, you're suddenly sending staff on emergency wine runs and watching your budget evaporate in real time. Print costs work the same way—you order 500 catalogs thinking you'll sell them over the show's run, but if opening night goes viral on social media, you're either turning away sales or paying rush fees for reprints.
Staff overtime during installation week is another semi-variable cost that compounds fast. A straightforward painting show might need 40 extra staff hours for installation. But if your art handlers discover the walls need patching, the lighting grid needs reconfiguration, or the artist shows up with different works than planned, those 40 hours become 80 hours at time-and-a-half rates.
Building scenario toggles that actually reflect gallery operations
The standard business advice of "model best case, worst case, and likely case" falls apart in gallery operations because too many variables interact in non-linear ways. A better approach uses scenario toggles that let you flip specific assumptions on and off to see how they cascade through your financials.
Never miss a key exhibition detail again.
Artioly helps you organize, promote, and manage every exhibition effortlessly.
- Unified exhibition scheduling
- Artist and visitor notifications
- Inventory and sales tracking
No credit card required
Start with attendance scenarios that reflect real patterns. Don't just model 200 vs. 400 visitors—model what happens when those visitors cluster differently. A show might get 300 total visitors, but if 250 come to opening night and only 50 trickle in over the next five weeks, your sales pattern, staffing needs, and even utility costs shift dramatically compared to steady traffic of around 60 visitors per week.
Your exhibition financial model needs toggles for:
Timing clusters: Opening week vs. steady state vs. closing week rush. Each pattern drives different cost and revenue profiles. Opening week might generate 70% of sales but also 40% of your variable costs. Steady-state weeks have lower costs but also lower conversion rates. Closing week sometimes triggers panic buying but requires extra staff for deinstallation.
Collector type mix: The ratio of existing collectors to new buyers to press and industry visitors fundamentally changes your economics. Existing collectors might convert at 3x the rate of new buyers but expect relationship pricing. New buyers pay full price but require more hand-holding and follow-up. Press visitors generate marketing value but zero direct revenue.
Artist market momentum: Toggle between rising market, stable market, and softening market scenarios. A rising market might justify higher price points and lower marketing spend. A softening market requires more aggressive pricing and heavier marketing investment to move inventory.
Operational complexity: Simple shows vs. complex installations. This isn't just about installation costs—complex shows require more specialized staff, create more insurance exposure, need longer installation periods that block other revenue activities, and often require custom fabrication that can't be reused.
These toggles should connect to your cost structure dynamically. When you flip from "simple installation" to "complex installation," your model should automatically adjust not just installation labor but also insurance premiums, equipment rental, potential property modifications, and the opportunity cost of extended gallery closure.
Here's a quick visualization of how those toggles flow through the model.
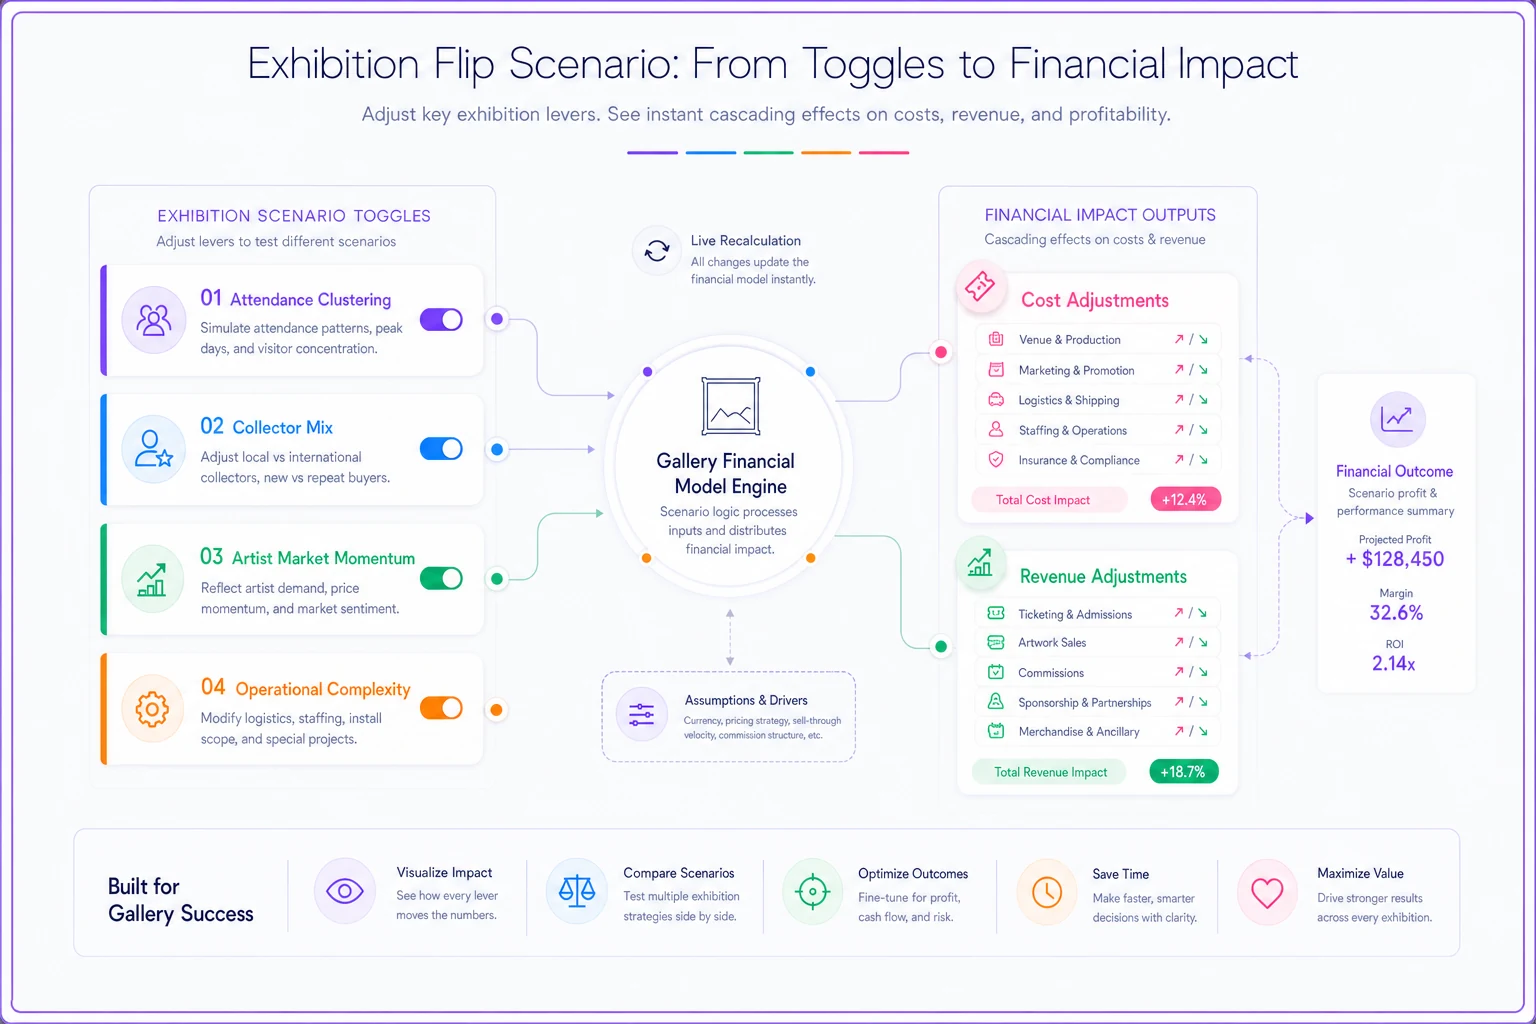
The graphic shows toggles on the left feeding into cost and revenue modules, with decision gates on the right.
Attendance, sponsorship, and sales thresholds that determine success
Raw attendance numbers tell you almost nothing about exhibition success on their own. What matters is the intersection of attendance quality, sponsorship commitments, and sales velocity at specific price points.
A useful threshold framework breaks down like this:
Minimum viable attendance: Usually around 120–150 qualified visitors, not including press, students, or industry tourists. Below this threshold, you lack the social proof and energy that drives sales. Collectors want to buy from galleries that feel vital and active.
Sales velocity threshold: You need to move at least one significant work ($10,000+) or three mid-tier works ($3,000–$7,000) within the first ten days. This early momentum predicts overall show performance with reasonable accuracy. Shows that don't hit this velocity threshold rarely recover, regardless of marketing efforts afterward.
Sponsorship breakpoints: Corporate sponsorship only makes sense above certain thresholds. Below $5,000, the administrative burden and brand integration requirements typically outweigh the benefit. Between $5,000 and $15,000, you're usually trading wall space and opening night access. Above $15,000, sponsors expect custom programming, exclusive events, and measurable PR value—which means additional costs that can quietly erode the sponsorship's net benefit.
Press coverage conversion: Not all press coverage translates to attendance or sales. A mention in a major publication might drive 50–100 visitors but zero sales if it's framed as cultural criticism rather than market coverage. Meanwhile, a small feature in a collector-focused newsletter might only drive 20 visits but result in two significant sales.
The relationships between these thresholds aren't linear. Once attendance drops below 30 visitors per week, galleries often see cascading failure—staff morale drops, word-of-mouth stalls, and collectors sense something is off. Similarly, sponsorship covering more than 30% of total exhibition budget can create perception problems where collectors question whether this is a commercial exhibition or a genuine art exhibition.
Decision gates for greenlighting or killing shows
The traditional approach of committing to shows six months out and hoping for the best is a relic from when galleries had more market power and collectors had fewer options. Modern gallery operations need stage-gate decision processes that let you pull the plug or pivot before costs compound.
Gate 1: Initial commitment (6 months out) At this stage, you're only committing to the concept and preliminary planning. Costs should stay below $2,000—mainly staff time for initial artist discussions and basic feasibility research. Decision criteria here focuses on artist trajectory, available inventory quality, and calendar fit. You're not greenlighting the full exhibition yet, just agreeing to move forward with planning.
Gate 2: Full budget approval (4 months out) This is where you commit real money—deposits for shipping, marketing contracts, catalog design. You need clear evidence of:
-
At least 60% of target inventory confirmed
-
Marketing hook identified and tested with key collectors
-
Sponsorship conversations progressing (if required for breakeven)
-
No competing shows in your market during the same window
If you can't check all four boxes, you either kill the show or significantly scale back scope.
Gate 3: Marketing launch (6 weeks out) By this point, you've spent maybe 40% of the total exhibition budget. The remaining 60% goes to final production, installation, and opening events. This gate requires:
-
Press release generating actual media interest, not just being sent out
-
Pre-sales or serious inquiries totaling at least 30% of breakeven
-
Opening night RSVPs tracking toward minimum viable attendance
-
All artworks confirmed and shipping arranged
Missing any of these triggers a scope reduction—smaller opening, reduced catalog run, simplified installation, or in extreme cases, converting to an online-only show.
Gate 4: Opening week adjustment (Week 1 of show) Most galleries treat opening night as the end of their control, but smart operators build in an opening week adjustment period. Based on initial response, you can:
-
Extend or reduce marketing spend
-
Adjust pricing on certain works
-
Add or cancel related programming
-
Shift staff resources to maximize sales during peak interest
The key is having these gates formally built into your exhibition financial model, not making ad-hoc decisions when problems surface. Each gate should have clear metrics, decision authority, and contingency plans ready to go.
Sample exhibition models across gallery types
Three realistic exhibition scenarios that show how these models play out in practice.
Scenario A: Emerging artist group show A small gallery in a secondary market plans a summer group show featuring four emerging local artists. Fixed costs run $8,500 (mainly space and base staff). Variable costs stay low at $3,500 (simple installation, minimal shipping, basic marketing).
-
Pessimistic
80 visitors, 2 sales, loss of $6,000
-
Realistic
140 visitors, 5 sales, profit of $3,000
-
Optimistic
200 visitors, 8 sales, profit of $9,000
The decision gates focus on early commitment from the artists' own networks. If the artists can't collectively guarantee 50 opening night attendees from their personal contacts by Gate 2, the show gets killed or converted to a pop-up format.
Scenario B: Mid-career solo exhibition An established gallery presents a solo show for an artist with growing market presence. Fixed costs reach $14,000 (including additional security and climate control for valuable works). Variable costs hit $18,000 (international shipping, custom framing, 64-page catalog, PR firm retainer).
Breakeven requires either three major works at $35,000 each or eight medium works at $15,000 each. The sponsorship toggle adds a $10,000 corporate sponsor which reduces the sales requirement but brings an additional private event costing $3,000.
-
Rising market
Price 10% above previous shows, expect 20% higher attendance
-
Stable market
Maintain previous pricing and attendance patterns
-
Softening market
Reduce prices 5%, increase marketing spend 40%
Gate 3 becomes critical here—if pre-sales don't hit $40,000 or press coverage doesn't materialize, they pivot to a smaller catalog run and simplified opening event, saving $7,000 in variable costs.
Scenario C: Blue-chip exhibition with loans A high-end gallery mounts an exhibition combining gallery inventory with museum loans. Fixed costs balloon to $22,000 (specialized insurance, enhanced security, extended hours). Variable costs reach $35,000 (art handlers, custom climate control installation, conservation assessment, full catalog production, opening gala for 300 guests).
-
Primary sales
2–3 major works at $150,000–$400,000
-
Secondary sales
Sourcing works for clients inspired by the exhibition
-
Sponsorship
$25,000 from a private bank partner
-
Catalog sales
500 units at $65 each
-
Future relationship value
Estimated downstream sales from new collectors
Decision gates here focus on risk mitigation. Gate 1 requires written confirmation from lending institutions. Gate 2 demands insurance approval and at least one anchor sale tentatively agreed upon. Gate 3 needs 200+ confirmed opening night RSVPs from qualified collectors. Any gate failure triggers immediate scope reduction or cancellation—the financial exposure is too high to absorb.
| Scenario | Costs | Breakeven & outcomes |
|---|---|---|
| Scenario A: Emerging artist group show | Fixed costs run $8,500 (mainly space and base staff). Variable costs stay low at $3,500 (simple installation, minimal shipping, basic marketing). | The breakeven point sits at four works sold at an average price of $3,000, assuming 50% commission. Pessimistic: 80 visitors, 2 sales, loss of $6,000; Realistic: 140 visitors, 5 sales, profit of $3,000; Optimistic: 200 visitors, 8 sales, profit of $9,000 |
| Scenario B: Mid-career solo exhibition | Fixed costs reach $14,000. Variable costs hit $18,000 (international shipping, custom framing, 64-page catalog, PR firm retainer). | Breakeven requires either three major works at $35,000 each or eight medium works at $15,000 each. Sponsor toggle example: $10,000 sponsorship minus $3,000 private event cost. |
| Scenario C: Blue-chip exhibition with loans | Fixed costs balloon to $22,000. Variable costs reach $35,000 (art handlers, custom climate control installation, conservation assessment, full catalog production, opening gala). | Revenue streams include primary sales of major works, secondary sales, $25,000 sponsorship, catalog sales, and future relationship value; gates require insurance and anchor commitments. |
The model becomes complex with multiple revenue streams and high fixed commitments; any gate failure triggers immediate scope reduction or cancellation.
Timing guidance aligned with gallery seasons
Gallery exhibition schedules follow predictable patterns that significantly impact financial performance. September and March shows typically see 30–40% higher attendance than August or January shows. It's not just about collector availability—it's about competitive dynamics, art fair schedules, and institutional programming that creates market momentum.
Your exhibition financial model needs seasonal adjustment factors:
September–November: Peak season with highest costs but also highest revenue potential. Budget 20% higher for marketing (more competition for attention) but model 25% higher attendance and 15% higher conversion rates. Opening nights during this period can draw twice typical attendance but also require twice the catering and staffing costs.
December–January: Rough for primary market sales but sometimes productive for secondary market activity. Fixed costs remain high (holiday overtime, heating costs) while variable costs can be pulled back. Many galleries program lower-cost group shows or works on paper during this stretch. Model 40% lower attendance and 50% lower average transaction values.
February–April: A strong period, especially around spring art fairs. Galleries often see spillover from fair visitors extending their trips. Budget for 15% higher marketing costs to capture fair-related attention, and model an increased out-of-town visitor percentage—typically lower conversion rates but higher average sales when they do buy.
May–July: Highly variable depending on market. Resort town galleries see summer peaks while urban galleries face the summer doldrums. Adjust models for local patterns, but generally expect 20% staff cost increases due to vacation coverage and roughly 25% lower local collector attendance, partially offset by tourist traffic.
The compound effect of poor financial modeling
When galleries operate without rigorous exhibition financial models, small misses compound into major problems. You overspend by $3,000 on one show, then cut corners on the next to compensate, which leads to poor attendance. Lower attendance makes artists nervous about future commitments. Nervous artists means you're selecting from weaker inventory. Weaker inventory means lower prices and margins. Lower margins mean more pressure to cut costs. The spiral accelerates.
Galleries have burned through $200,000 in working capital over 18 months simply because they never built proper financial models for their exhibition program. They kept believing the next show would recoup the last show's losses—but without understanding their true cost structure or break-even points, they were essentially gambling with worse odds each round.
The inverse is equally powerful. Galleries with strong financial models can make confident bets on challenging shows because they know exactly what needs to happen for success. They can tell sponsors precisely what value they'll receive. They can negotiate with artists from a position of knowledge rather than hope. They can kill shows early when the numbers don't work, preserving capital for better opportunities.
Building your exhibition financial model infrastructure
Start with a simple spreadsheet that captures your last six exhibitions' actual costs and revenues. Don't trust your memory or general ledger—go through credit card statements, receipts, and timesheets to build true cost pictures. Most galleries discover they've been underestimating costs by 25–35% when they do this exercise properly.
Create separate tabs for:
-
Fixed cost templates by gallery area
-
Variable cost lists by exhibition type
-
Attendance patterns by month and show type
-
Sales conversion rates by price point and collector segment
-
Sponsorship packages with true fulfillment costs
-
Staff hour requirements by exhibition complexity
Build in automatic calculations that cascade changes through the model. When you adjust attendance projections, marketing costs should adjust proportionally. When you add sponsorship, associated event costs should populate automatically. This removes emotion from the planning process and highlights true financial implications before you're too deep to change course.
Reconcile credit card statements, receipts, and timesheets when building past cost pictures to avoid underestimating true expenses.
The most operationally mature galleries integrate their exhibition financial models with their management software, automatically pulling in historical data, tracking actual versus projected performance, and flagging when exhibitions drift off track. This kind of real-time visibility lets them adjust their on-site conversion tactics during the show rather than conducting post-mortems after losses are already locked in.
Making the model work in practice
The gap between having a financial model and actually using it to drive decisions is where most galleries fail. You build a solid spreadsheet in January, use it for one show, then abandon it when things get busy. By June, you're back to gut decisions and hoping for the best.
Successful implementation requires process discipline. Every exhibition proposal should generate a financial model before any other planning begins. The model becomes the source of truth for all subsequent decisions. When an artist wants to add works, you update the model. When sponsorship falls through, you update the model. When pre-sales exceed expectations, you update the model.
It feels like overhead initially, but it prevents the nasty surprises that kill gallery cash flow. You know weeks in advance when a show is trending toward losses. You can adjust scope, increase marketing, pursue additional sponsorship, or make the hard decision to cut losses early before the damage compounds.
The model also becomes a useful tool for artist relations. Instead of vague promises about promotion and support, you can show artists exactly how much you're investing in their success. When you need to negotiate commission splits or ask for price flexibility, the model gives you objective grounding for those conversations rather than leaving both sides guessing.
The bottom line on exhibition financial modeling
Exhibitions will always carry risk—art markets are inherently unpredictable, and collector behavior can shift quickly. But operating without a financial model transforms manageable risk into reckless gambling. The galleries that survive and thrive over decades are the ones that balance artistic vision with operational discipline.
Your exhibition financial model won't eliminate failures, but it will help you fail fast and cheap rather than slow and expensive. It will surface opportunities you might otherwise miss. It will give you confidence to take calculated risks on emerging artists or experimental shows. Most importantly, it will prevent the cascading financial failures that force galleries to compromise their artistic vision just to keep the doors open.
The investment in building and maintaining these models—roughly 20–30 hours upfront, then 2–3 hours per exhibition—pays for itself the first time you avoid a $20,000 loss by killing a doomed show early. Every subsequent save is pure upside that lets you invest in the exhibitions that actually matter for your gallery's long-term health.
Exhibitions will always carry risk—art markets are inherently unpredictable, and collector behavior can shift quickly. But operating without a financial model transforms manageable risk into reckless gambling. The galleries that survive and thrive over decades are the ones that balance artistic vision with operational discipline.
The investment in building and maintaining these models—roughly 20–30 hours upfront, then 2–3 hours per exhibition—pays for itself the first time you avoid a $20,000 loss by killing a doomed show early. Every subsequent save is pure upside that lets you invest in the exhibitions that actually matter for your gallery's long-term health.
Ready to elevate your gallery operations?
Join 500+ galleries using Artioly to streamline operations, boost visitor engagement, and increase art sales.