



Most galleries already have some kind of exhibition budget. The problem is almost never the existence of a spreadsheet — it's that the spreadsheet is a flat list of costs with a revenue guess at the bottom, no payment timing, no scenario logic, and no decision rule attached to it. So when the question comes up — "Do we actually commit to this September show?" — the sheet can't answer it. Somebody eyeballs the total, says "feels okay," and the gallery finds out in week three that the sponsor money lands after the install invoices are due.
This is a build guide, not a theory piece. If you've already read the exhibition financial model and break-even playbook, think of this as the companion that turns the thinking into an actual working file with cells you can type into. I'll give you the tab structure, the named variables, the exact formulas (works in both Excel and Google Sheets unless noted), and the decision gate you bolt onto the end so the model does more than describe — it decides.
Build it once. Reuse it for every show.
The structure: six tabs, in this order
Don't overbuild. The galleries that actually keep their model updated use something compact. Here's the layout that survives contact with a busy install week:
-
Inputs — every assumption lives here, nowhere else
-
Cashflow — week-by-week timing of money in and out
-
Sponsors — cash + in-kind valuation
-
Costs — fixed, variable, and semi-variable lookup tables
-
Scenarios — Worst / Likely / Best plus attendance bands
-
Dashboard — KPIs and the decision gate
One rule that makes the whole thing work: no hard-coded numbers anywhere except the Inputs tab. Every other cell references Inputs. When your artist's shipping quote changes, you update one cell and the entire model adjusts. The most common failure in gallery spreadsheets is the same number typed into nine different places, four of which never get updated.
Tab 1 — Inputs (the control panel)
Put this in the top-left so it opens fast. Use named ranges so your formulas read like sentences instead of =B4*B7. In both Excel and Sheets you name a cell by selecting it and typing the name into the Name Box (top-left corner).
Never miss a key exhibition detail again.
Artioly helps you organize, promote, and manage every exhibition effortlessly.
- Unified exhibition scheduling
- Artist and visitor notifications
- Inventory and sales tracking
No credit card required
| Label | Value | Named range |
|---|---|---|
| Exhibition run (weeks) | 6 | run_weeks |
| Expected attendance (likely) | 1,400 | att_likely |
| Avg conversion to sale (%) | 3.2% | conv_rate |
| Avg sale value | $2,800 | avg_sale |
| Gallery commission (%) | 45% | commission |
| Exhibitor / table fee (per unit) | $350 | exhibitor_fee |
| Number of exhibitor units | 8 | exhibitor_units |
| Confirmed cash sponsorship | $6,000 | sponsor_cash |
| Fixed costs total (from Costs tab) | — | fixed_total |
| Variable cost per attendee | $4.50 | varperatt |
| Scenario selector (1=Worst 2=Likely 3=Best) | 2 | scenario_pick |
| Attendance band adjust (%) | 0% | att_band |
Two columns people consistently forget: a source note and a last-updated date next to each assumption. When a number is three months stale, you want to see it. A =TODAY() reference or a manual date in column D saves arguments later about whose shipping quote you were actually using.
One thing worth flagging: your "expected attendance" should never sit buried as a settled fact. It's the variable everything else swings on, which is why it gets both a named range and a band adjuster (att_band) — so you can stress-test it without retyping the core assumption.
Tab 2 — Cashflow (timing is where shows actually die)
A show can be profitable on paper and still bounce a cheque. The classic sequence: you pay the shipper and installer in week −2, the printer in week −1, but the sponsor's "commitment" pays 30 days after opening, and sales settle even later once you account for the collector who "will transfer next week."
Build this as a week-by-week grid. Columns across the top are weeks (−4 through +8 around the opening works well). Rows are line items. Each cell holds the amount expected that week, not the total.
Set up a running-balance row. If your weekly net is in row 20 (columns C through N), the cumulative cash position in row 21 looks like:
C21 = C20
D21 = C21 + D20
Then drag D21 right across all week columns. Your opening cash buffer goes in B21:
B21 = starting_cash
C21 = B21 + C20
The cell you actually watch is the minimum of the cumulative row — your worst cash moment:
=MIN(C21:N21)
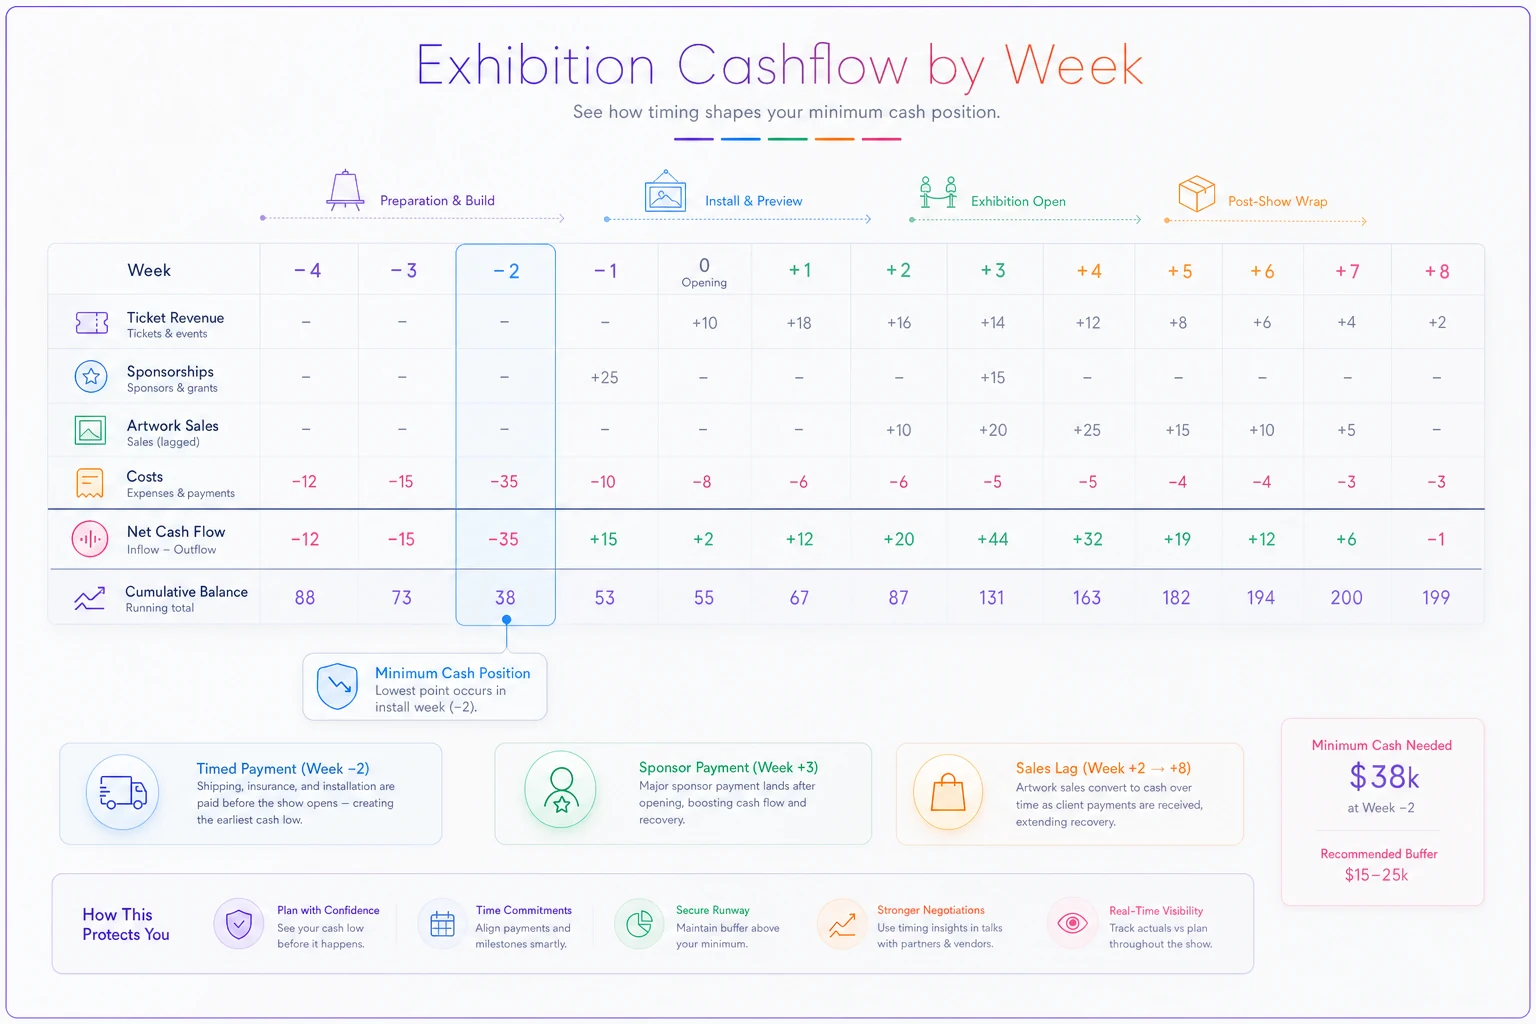
If that number goes negative, you don't have a profitability problem, you have a sequencing problem. The fix is usually renegotiating when the sponsor pays or collecting a deposit on exhibitor fees upfront — not cutting the show itself.
Galleries that collect exhibitor fees at signing instead of at opening routinely flip a negative week −2 into a positive one. The money is identical; the timing is everything. Model it both ways and look at the MIN cell.
Tab 3 — Sponsors, including in-kind (the number people fudge)
Cash sponsorship is straightforward. In-kind is where galleries either lowball themselves or quietly deceive their board. A wine partner "sponsoring the opening" is worth something — but only the amount you'd otherwise have spent, not the retail value they're quoting you.
| Sponsor | Type | Stated value | Avoided-cost value | Offsets which cost line? |
|---|---|---|---|---|
| Regional bank | Cash | $6,000 | $6,000 | n/a |
| Wine partner | In-kind | $1,800 | $420 | Opening catering |
| Framer | In-kind | $2,200 | $900 | Framing budget |
| Print shop | In-kind | $600 | $600 | Signage |
Total usable sponsorship for break-even:
=sponsorcash + SUMIF(SponsorsType, "In-kind", Sponsors_AvoidedCol)
Feed that into the Inputs tab as a single named value sponsor_total. The gap between stated value and avoided-cost value in that table is often 50–60% — and that gap is exactly the self-deception that makes a show look funded when it isn't.
Tab 4 — Costs with semi-variable lookup tables
Three cost types, and the middle one trips people up.
Fixed costs — install labour, insurance rider, PR flat fee, artist fee — get summed into fixedtotal. Variable costs scale per attendee (catering per head, printed guides) and live in varper_att. Semi-variable costs step up at thresholds, and that's where most models fall apart.
| Attendees (opening) | Guards needed | Cost |
|---|---|---|
| 0 | 1 | $220 |
| 151 | 2 | $440 |
| 301 | 3 | $660 |
Name the first column range and cost column, then:
=XLOOKUP(openingattendance, tiermin, tiercost, , -1)
The -1 match mode means "exact match or next smaller," which is exactly how tier pricing works. If you're on an older Excel without XLOOKUP:
=VLOOKUP(openingattendance, tier_table, 3, TRUE)
Build one of these tables for every stepped cost — security, cleaning crews, parking attendants. The mistake is modelling stepped costs as smooth per-head numbers. A show at 310 attendees isn't marginally more expensive than 290; it crossed a threshold and added an entire guard shift.
Tab 5 — Scenarios with CHOOSE and attendance bands
Now make the model swing. You've got scenariopick on the Inputs tab (1/2/3). Use CHOOSE to pull the right attendance figure:
=CHOOSE(scenariopick, attworst, attlikely, att_best)
Where attworst, attlikely, attbest are three named cells — say 900, 1,400, and 2,100.
Then layer the band adjuster on top so you can nudge within a scenario:
scenarioattendance = CHOOSE(scenariopick, attworst, attlikely, attbest) * (1 + att_band)
Set att_band to −10%, −5%, 0%, +5%, +10% and watch the dashboard move. This matters because reality rarely lands on one of three neat scenarios — it lands at "likely but 8% soft because it rained opening weekend."
Revenue then flows from scenarioattendance:
salesrevenue = scenarioattendance convrate avgsale commission
exhibitorrevenue = exhibitorfee exhibitorunits
totalrevenue = salesrevenue + exhibitorrevenue + sponsortotal
Tab 6 — Break-even, KPIs, and the decision gate
Break-even that actually includes sponsors and exhibitor fees
The error in most gallery models is treating break-even as "cover the costs with sales." Sponsors and exhibitor fees reduce the sales you need. Your real break-even attendance:
breakevenatt = (fixedtotal - sponsortotal - exhibitorrevenue) / (convrate avgsale commission - varperatt)
The denominator is contribution per attendee net of variable cost — don't forget to subtract varperatt, or your break-even will read artificially low.
The KPI dashboard layout
-
Projected net surplus/deficit (scenario-driven)
-
Break-even attendance
-
Margin of safety %
-
Worst cash week (the MIN cell from Cashflow)
-
Usable sponsorship vs stated (shows your honesty)
-
Cost per attendee (all-in)
The decision-gate checklist
-
Margin of safety ≥ 15% at the Likely scenario
-
Worst cash week stays above your minimum buffer (never below $0, ideally above a set floor)
-
Even the Worst scenario deficit is one the gallery can absorb without touching reserves
-
Usable (avoided-cost) sponsorship — not stated value — covers at least the amount you've assumed
-
Every Inputs assumption dated within the last 60 days
If two or more fail, it goes to a conditional state: the show can proceed only after a named person fixes the specific failed gate (renegotiate sponsor timing, cut a cost tier, raise exhibitor fees). If the Worst-case deficit exceeds reserves, it's a cancel — regardless of how good the Likely number looks.
A simple governance matrix for who decides what:
| Decision | Who signs off | Based on |
|---|---|---|
| Greenlight (all gates pass) | Director | Dashboard |
| Conditional (1 gate fails) | Director + finance lead | Named remediation |
| Hold/renegotiate (2 gates) | Director + board chair | Revised model |
| Cancel (Worst > reserves) | Board | Reserve policy |
Keep it to six cells a tired person can read in ten seconds:
A real scenario, run through the model
A two-person commercial gallery was planning a six-week group show with eight exhibiting artists. Their first-pass flat spreadsheet showed a tidy ~$7k surplus, so they were ready to commit.
Rebuilt in this structure, three things surfaced:
Their $4,000 of "in-kind sponsorship" was worth about $1,300 in avoided cost — real sponsorship dropped considerably. The sponsor cash (~$5,000) was contracted to pay 30 days post-opening, but the installer and shipper (~$6,800) were due in week −2, putting their worst cash week at around −$4,100. They'd have overdrawn. And at Likely attendance, their margin of safety was sitting at about 9%, well below the 15% gate.
None of this made the show a bad idea. It made it a badly sequenced one. They collected exhibitor fees at signing (pulling roughly $2,800 forward), got the sponsor to split payment 50% on signing, and dropped one stepped-up security tier by capping opening-night RSVPs. Worst cash week moved to around +$900, margin of safety to about 17%. Same show — now it cleared every gate. The surplus landed close to their original estimate, but this time they knew it would actually be in the bank when the invoices arrived.
When this model makes sense — and when it's overkill
Use the full six-tab build when: the show has sponsors, exhibitor or table fees, timed payments, or any cost above a few thousand dollars where getting it wrong actually hurts. Group shows, art-fair-style formats, and anything with external money attached all justify it.
It's overkill when: you're hanging a small solo show of existing inventory with no sponsors, no install crew, and no catering. A three-row calculation is fine there — don't build governance around a show that can't lose you more than a few hundred dollars.
Who should skip the decision gate entirely: nobody, really — but keep it proportionate. A gallery doing one show a quarter doesn't need a four-tier governance matrix; the director-plus-one check is plenty. The matrix earns its keep once you're running enough shows that "I had a good feeling about it" stops being an auditable reason.
The point of building this isn't to add admin. A spreadsheet with timing, honest sponsor valuation, and a hard gate attached will tell you no on the one show a year that would have quietly drained a quarter's reserves — and yes with confidence on the four that are genuinely fine. That trade is worth an afternoon of building named ranges.
Start with the Inputs tab. Get every assumption into one place with a date next to it. The rest of the model is just honest arithmetic pointed at that panel.
Ready to elevate your gallery operations?
Join 500+ galleries using Artioly to streamline operations, boost visitor engagement, and increase art sales.