


Most small galleries don't have a data problem. They have a stitching problem. The exhibition calendar lives in one person's head, inventory sits in a spreadsheet that only the registrar updates, sales are tracked in the accountant's QuickBooks file, and the collector list is scattered across two CRMs and a Gmail contacts export. Every piece exists. Nothing connects.
So when a curator makes a decision — say, dedicating the fall slot to an emerging painter instead of a proven mid-career artist — nobody can trace what that choice actually did. Did it move inventory? Did it bring in new collectors or just entertain the existing ones? Did it clear the show's costs? Six months later you're guessing, and the next programming decision gets made on the same vibes that got you here.
A real gallery performance system isn't a dashboard. It's the plumbing underneath the dashboard: one agreed way of naming things, a hierarchy of metrics that roll up cleanly, clear ownership of each number, and a review rhythm that forces the org to actually look. Get those four things right and you can draw a line from a curatorial hypothesis all the way to a financial outcome. Get them wrong and you'll keep buying software that produces prettier versions of the same fog.
Here's how the whole thing fits together, where it breaks as you grow, and what a worked example looks like end to end.
Start with the canonical data model, or nothing else works
The single most common reason gallery reporting is useless: the same thing has five different names across five systems. One artwork is "Untitled (Blue), 2023" in the inventory sheet, "Blue #4" in the price list, "the big blue one" in the sales email thread, and a random SKU in accounting. Now try to answer "how did that piece perform?" You can't, because no system agrees it's the same object.
A canonical data model just means: for every important entity in your gallery, there is one master record and one master ID, and everything else references it. You don't need a database engineer. You need discipline about a handful of core entities.
-
Artwork — a unique ID that never changes, tied to artist, medium, dimensions, year, edition info, cost basis, and current status.
-
Artist — one record, with consignment terms, royalty terms, and contact info attached.
-
Exhibition / Show — a container with a start and end date, a budget, an assigned curator, and a list of the artworks in it.
-
Collector / Contact — one record per person, deduplicated, with acquisition history and relationship stage.
-
Transaction — a sale, consignment payout, or expense, each linked back to the artwork, show, and collector it belongs to.
The magic isn't in the list. It's in the relationships. An artwork belongs to an artist and appears in a show. A transaction points to an artwork, a collector, and a show. Once those links exist, questions that used to take an afternoon of spreadsheet archaeology become a single filter: "Show me every sale from the spring emerging-artists show, by collector segment, net of consignment splits."
Agree on a short list of canonical entities and their ID formats early, and document them where people create records so the five-name problem never starts.
Where this breaks in practice is status tracking. A fairly typical gallery I've seen had eleven different words floating around for artwork state — "available," "on hold," "reserved," "pending," "sold pending payment," "out on approval," and so on — with no shared definition. Two people looked at the same piece and gave a collector two different answers in the same week. The fix wasn't more software. It was agreeing on six status values, writing down what each one means, and making the inventory record the only place that status lives. The artwork lifecycle stages matter here, and if you haven't nailed down how a piece moves from intake to sold, that's the prerequisite work.
Build a KPI hierarchy, not a metrics dump
Once your data references a single source of truth, the temptation is to measure everything. Resist it. Forty metrics is just fog with decimal points.
Never miss a key exhibition detail again.
Artioly helps you organize, promote, and manage every exhibition effortlessly.
- Unified exhibition scheduling
- Artist and visitor notifications
- Inventory and sales tracking
No credit card required
A KPI hierarchy has three levels, and each level answers a different person's question.
Level 1 — the two or three numbers the owner watches. Outcome metrics. For most small galleries that's net contribution per show, sell-through rate, and collector retention. If those three are healthy, the gallery is basically working.
Level 2 — the drivers. These explain why the top-level numbers moved. Under sell-through you'd have average days-to-sale, percentage of works reserved during the opening week, and discount depth. Under retention you'd have repeat purchase rate and lapse rate by collector segment.
Level 3 — the operational inputs. The things staff actually control day to day: collector previews sent before the opening, condition reports completed on time, follow-up emails sent within 48 hours of an inquiry, artwork records with complete images and pricing.
The point of the hierarchy is diagnosis. When net contribution per show drops, you don't panic — you walk down the tree. Sell-through held but discount depth widened? You gave away margin. Sell-through fell but inquiries were normal? Your follow-up cadence broke. This is the difference between "sales are down" and "sales are down because inquiries from the opening weren't followed up within two days, and 40% went cold." One is a feeling. The other is a fixable process.
Here's a compact version of how the levels connect:
| Level | Metric | Owner | Reviewed |
|---|---|---|---|
| Outcome | Net contribution per show | Owner / Director | Quarterly |
| Outcome | Sell-through rate | Owner / Director | Quarterly |
| Outcome | Collector retention rate | Owner / Director | Quarterly |
| Driver | Avg. days-to-sale | Sales lead | Monthly |
| Driver | Discount depth (%) | Sales lead | Monthly |
| Driver | Opening-week reservation rate | Curator + Sales | Per show |
| Input | Inquiries followed up < 48h | Front of house | Weekly |
| Input | Artwork records complete | Registrar | Weekly |
| Input | Collector previews sent | Sales lead | Per show |
The mistake galleries make is reporting Level 3 inputs to the owner and Level 1 outcomes to the front-of-house staff. Nobody can act on numbers that live above or below their control. Match the metric to the person who can actually move it.
Role ownership: every number needs a name next to it
A metric with no owner is a metric that gets watched by everyone and improved by no one. This is where most performance systems quietly die — not because the data was wrong, but because when a number went red, there was no single person whose job it was to notice and respond.
Ownership doesn't mean that person does all the work. It means one named person is accountable for the number being accurate and for raising a flag when it moves. In a three-person gallery those roles double up, and that's fine — what matters is that it's written down.
-
Registrar owns the data integrity layer. Artwork records complete, statuses accurate, condition reports current. If the canonical data is wrong, everything downstream is wrong — this role is more important than it usually gets credit for.
-
Sales lead owns the conversion and collector layer. Follow-up cadence, reservation rates, discount discipline, retention.
-
Curator owns the programming hypothesis. What show, which artists, what they expect it to do — and, critically, they own reviewing whether it did.
-
Owner/director owns the outcome layer and the review itself. They don't chase inputs. They chase whether the top-level numbers are trending right.
The pattern worth naming: galleries almost always assign ownership of sales but forget to assign ownership of the curatorial bet. So when a show underperforms, the conversation becomes "the market's soft" instead of "our hypothesis about that artist was wrong, here's what we learned." Treating programming as a testable hypothesis with an owner who reviews results is what turns curation from taste into a learning loop. If that framing is new, the idea of treating curation as a hypothesis with real feedback loops is worth sitting with before you build the rest of this system.
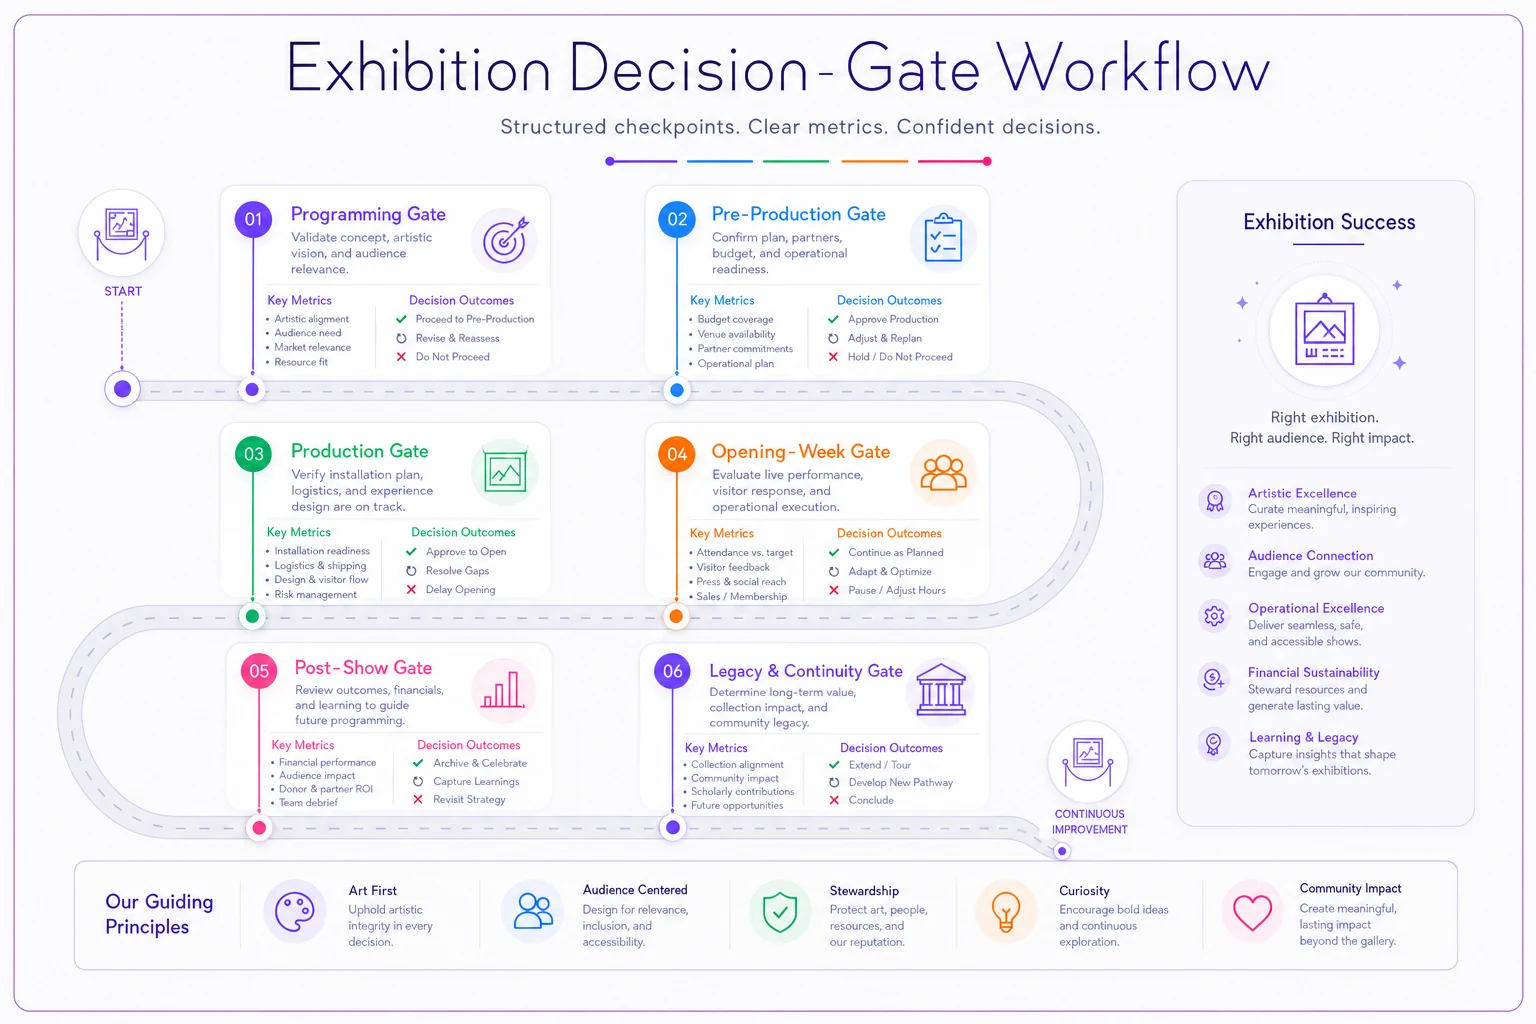
Decision gates: where the system actually earns its keep
A canonical model and a KPI tree are diagnostic. Decision gates are what make them operational. A gate is a defined checkpoint where you look at specific numbers and make a go / adjust / stop call before committing the next chunk of money or attention.
-
Programming gate (roughly 5–6 months out). Curator proposes a show with an explicit hypothesis: which collectors it targets, expected sell-through range, and the budget it needs to break even. This is where you sanity-check the bet against actual data — has this artist or this price band moved before?
-
Pre-production gate (10–12 weeks out). Are the works confirmed, consigned, photographed, and priced? Incomplete artwork records here become sales problems later.
-
Opening-week gate. Reservation rate versus target. This is your earliest real signal. A show tracking well past opening usually keeps tracking well; a dead opening week rarely rescues itself, so this is the moment to change the follow-up push, not three weeks later.
-
Post-show gate. Actual net contribution versus the break-even model, plus what the show taught you about the collector base. This feeds directly back into the next programming gate.
A quick visual of the exhibition gate workflow helps make the timing and decisions clear.
The break-even discipline underneath gate one and gate four is non-negotiable — if you don't have a real exhibition financial model, your gates have nothing to check against. The exhibition break-even playbook is the companion piece here; the gates are how you use that model instead of building it once and filing it away.
A worked example: curator choice → inventory change → financial outcome
The choice. At the programming gate, the curator proposes giving the fall slot to an emerging ceramicist rather than repeating a reliable landscape painter who sells steadily but only to the same four collectors. The hypothesis, written down: "This artist reaches a younger design-adjacent buyer we've been failing to convert. Expected sell-through 45–55%, target net contribution around $9k–$12k." Twenty-two works, priced $1,400–$6,500, 50/50 consignment split.
The inventory change. Because the works are consigned, they enter inventory as a batch. The registrar creates 22 canonical artwork records — complete images, dimensions, cost basis (zero, since consigned), edition info, and status "available." This is the step galleries skip under time pressure, and it's exactly the step that makes the financial outcome traceable later. Every one of those records links to the show and the artist.
The opening-week signal. By the end of opening week, 7 of 22 works are reserved — a 32% reservation rate, below the ~40% the sales lead flags as healthy for a show this size. The gate triggers a response: the sales lead pulls the inquiry list, finds 14 warm contacts who came through the door but didn't reserve, and runs a focused 48-hour follow-up. Three more works reserve.
The financial outcome. By close, 12 of 22 works sold — 55% sell-through, top of the projected range. Gross sales land around $41k. After the 50% consignment split (~$20.5k to the artist) and roughly $9k in show costs (shipping, install, opening, marketing), net contribution comes to about $11.5k — inside the target. But the real payoff is in the collector layer. Of the 12 buyers, 5 were new to the gallery, and 4 of those fell into exactly the younger design-adjacent segment the curator hypothesized. The bet wasn't just "did this show make money" — it was "did this show extend our collector base," and the data says yes. That's a fundamentally different post-show conversation than "we did okay." It tells you to program more in that direction, and it tells you which 5 new collectors now need a stewardship plan so they don't lapse. How you move that cohort from first purchase into repeat buyers is its own discipline — the collector lifecycle stages and stewardship cadence picks up exactly where this show closes. Notice what made the whole chain legible: canonical artwork records linked to the show, a reservation-rate metric with an owner who acted at the gate, and a post-show review that checked outcome and collector composition. Pull any one of those out and the story collapses back into "the ceramics show went fine, I think."
What changes as you grow
At two people, most of this runs on a shared spreadsheet and a standing Friday check-in, and that's genuinely fine. The canonical IDs matter even at that size, but you can hold a lot of the relationships in your head.
The break happens somewhere around six or more shows a year, a few hundred works in inventory, and a staff member touching the data who wasn't there when the naming conventions got invented. That's when the informal system silently degrades — statuses drift, follow-ups fall through the gap between the person who took the inquiry and the person who closes, and the quarterly review becomes an argument about whose numbers are right instead of what the numbers mean.
At that stage, the value of connected operational software isn't automation for its own sake — it's that the canonical model gets enforced instead of hoped for. When inventory, sales, and collector records live in one connected system, a status change on an artwork updates everywhere at once, a follow-up task fires automatically when an inquiry logs, and the KPI hierarchy rolls up without anyone rebuilding a spreadsheet the night before the review. AI-assisted tools help most in the boring reconciliation layer: flagging artwork records missing images before a gate, surfacing inquiries that went cold, catching the discount that quietly blew past your floor. The goal is to remove the manual stitching that makes the whole system fragile, so the humans spend their attention on the curatorial bet and the collector relationship — the parts that actually can't be automated.
When to build this — and when not to bother yet
Build it now if: you're running four-plus shows a year, you can't currently answer "what was our net contribution on the last show" in under ten minutes, or you've had two people give a collector conflicting answers about the same piece. Those are the symptoms that the informal system has already broken; you just haven't paid for it yet.
Don't over-engineer it if: you're a solo operation doing one or two shows a year with a couple dozen works. You need the canonical IDs and a break-even model. You do not need a three-level KPI hierarchy with role ownership for a team of one — you'll spend more time maintaining the system than running the gallery.
This is the wrong project entirely if your actual problem is upstream — consignment terms aren't nailed down, pricing isn't disciplined, inventory statuses are chaos. A performance system measures a functioning operation. It won't fix a broken one; it'll just measure the brokenness more precisely. Get the foundational governance in place first, then build the measurement layer on top.
The through-line
The reason a gallery performance system matters isn't that dashboards are nice. It's that without one, every decision your gallery makes — which artist to program, when to discount, which collector to chase — happens with a broken feedback loop. You act, something happens, and you never cleanly learn whether the action caused the outcome. You just accumulate hunches.
A canonical data model gives you one truth to reason from. A KPI hierarchy tells you where to look when a number moves. Role ownership makes sure someone actually looks. And decision gates force the looking to happen before the next commitment instead of after. Wire those four together and the ceramics show stops being a story you tell over drinks and becomes a piece of evidence that makes the next ten shows smarter. That compounding — where each show sharpens the next bet — is the entire point.
The reason a gallery performance system matters isn't that dashboards are nice. It's that without one, every decision your gallery makes — which artist to program, when to discount, which collector to chase — happens with a broken feedback loop. You act, something happens, and you never cleanly learn whether the action caused the outcome. You just accumulate hunches.
A canonical data model gives you one truth to reason from. A KPI hierarchy tells you where to look when a number moves. Role ownership makes sure someone actually looks. And decision gates force the looking to happen before the next commitment instead of after. Wire those four together and the ceramics show stops being a story you tell over drinks and becomes a piece of evidence that makes the next ten shows smarter. That compounding — where each show sharpens the next bet — is the entire point.
Ready to elevate your gallery operations?
Join 500+ galleries using Artioly to streamline operations, boost visitor engagement, and increase art sales.