



Most galleries don't have a performance problem. They have a context problem.
You can look at a spreadsheet showing a 22% sell-through rate on your last show and feel fine about it. Or feel terrible about it. The number alone tells you nothing, because you have no idea whether 22% puts you in the top third of galleries your size or the bottom. That gap — between a raw number and one you can actually act on — is where a lot of small galleries quietly stall for years.
A gallery benchmarking toolkit fixes the context problem. Not by giving you more data (you already have more than you use), but by stacking your numbers against peers who look like you: same staff size, same revenue mix, same rough scale. Once you know where you sit on the curve, target-setting stops being a guessing game.
This piece walks through how to build and read that comparison — the percentile tables, a simple placement calculator, and the decision rules that tell you what to chase next based on your structure, not someone's aspirational Instagram.
Why raw KPIs mislead small galleries specifically
Most benchmarking advice is written for institutions with 40 staff and a development department. Small commercial galleries — two to six people, founder usually still hanging work — operate under completely different physics.
At small scale, variance is enormous. One good collector relationship can swing your annual revenue by 30%. A single museum placement can make a quiet artist suddenly bankable. So when you look at a KPI in isolation, you're often looking at noise dressed up as signal.
A typical example: a two-person gallery reports average days-to-sale of 140. Sounds slow. But among galleries with no dedicated sales staff and a program weighted toward emerging artists, 140 days is actually around the median. The owner was about to overhaul their entire pricing approach to fix a number that wasn't broken.
The pattern that keeps showing up is galleries reacting to absolute numbers — either panicking over healthy metrics or celebrating weak ones. Percentiles kill that confusion. A metric at the 60th percentile means something. A metric of "140 days" means nothing until you know the distribution.
The core metrics worth benchmarking (and the ones that waste your time)
You don't need 30 KPIs. For a small gallery, five to seven carry almost all the decision weight. The rest are vanity or derivatives.
Never miss a key exhibition detail again.
Artioly helps you organize, promote, and manage every exhibition effortlessly.
- Unified exhibition scheduling
- Artist and visitor notifications
- Inventory and sales tracking
No credit card required
-
Sell-through rate per show — works sold ÷ works exhibited
-
Revenue per represented artist — total sales ÷ number of represented artists
-
Repeat-collector revenue share — % of revenue from collectors who've bought before
-
Average days-to-sale — from hang date (or availability) to confirmed sale
-
Revenue per staff FTE — total revenue ÷ full-time-equivalent staff
-
Show contribution margin — net margin after direct show costs
-
Pipeline conversion — inquiries that become sales
Notice what's not there: foot traffic, Instagram followers, mailing-list size, number of openings. Those feel measurable but rarely predict revenue at small scale. Foot traffic in particular is a trap — plenty of busy galleries sell nothing, and plenty of quiet by-appointment rooms do extremely well. If you want to connect visitor activity to actual outcomes, that belongs in a different system entirely, closer to the logic in why the visitor engagement funnel converts visitors into buyers.
Percentile tables: what the distribution actually looks like
Here's an illustrative percentile table for small commercial galleries (roughly 2–6 staff, sub-$2M annual sales). These are directional benchmarks drawn from operational patterns across this gallery size band — treat them as a starting map, not gospel, and adjust for your local market and program type.
| Metric | 25th pct | 50th (median) | 75th pct | 90th pct |
|---|---|---|---|---|
| Sell-through per show | 14% | 26% | 41% | 58% |
| Revenue per represented artist | ~$9k | ~$22k | ~$48k | ~$95k |
| Repeat-collector revenue share | 20% | 35% | 52% | 68% |
| Avg days-to-sale | 190 | 130 | 75 | 40 |
| Revenue per staff FTE | ~$95k | ~$175k | ~$290k | ~$470k |
| Show contribution margin | -5% | 12% | 28% | 44% |
A few things jump out when you read this honestly.
The spread between the 25th and 90th percentile is massive — revenue per FTE ranges roughly 5x across the band. That tells you small-gallery outcomes aren't mostly about market luck; structure and discipline move the needle hard.
Days-to-sale runs backwards — lower is better — so a gallery at 190 days isn't lagging by a little, it's in the bottom quartile. And notice the 25th percentile show margin is negative. That's not a typo. A meaningful share of small galleries lose money on a typical show and subsidize it with secondary-market or back-room sales. If that's you, you're not alone, but you're also not sustainable.
The simple placement calculator
You don't need software to place yourself. The calculation is deliberately crude because precision here is false comfort.
-
Pull your actual number for the trailing 12 months.
-
Find which two percentile columns it falls between in the table.
-
Estimate your rough position (e.g., your sell-through of 33% sits between the 50th and 75th — call it ~62nd percentile).
-
Write the percentile, not the raw number, next to each metric.
-
Repeat for all six metrics.
Now you have a profile, not a scorecard. The profile is what matters.
A typical small gallery profile looks lopsided — strong on one or two metrics, weak on others. A photography-focused gallery might land at the 80th percentile on repeat-collector share but the 30th percentile on revenue per artist. That shape immediately tells you the strategy: they're excellent at retention but under-monetizing their roster, probably through underpricing or carrying too many artists who don't sell. The lopsidedness is the insight. A flat profile across all metrics almost never happens, and when it does it usually means the data is wrong.
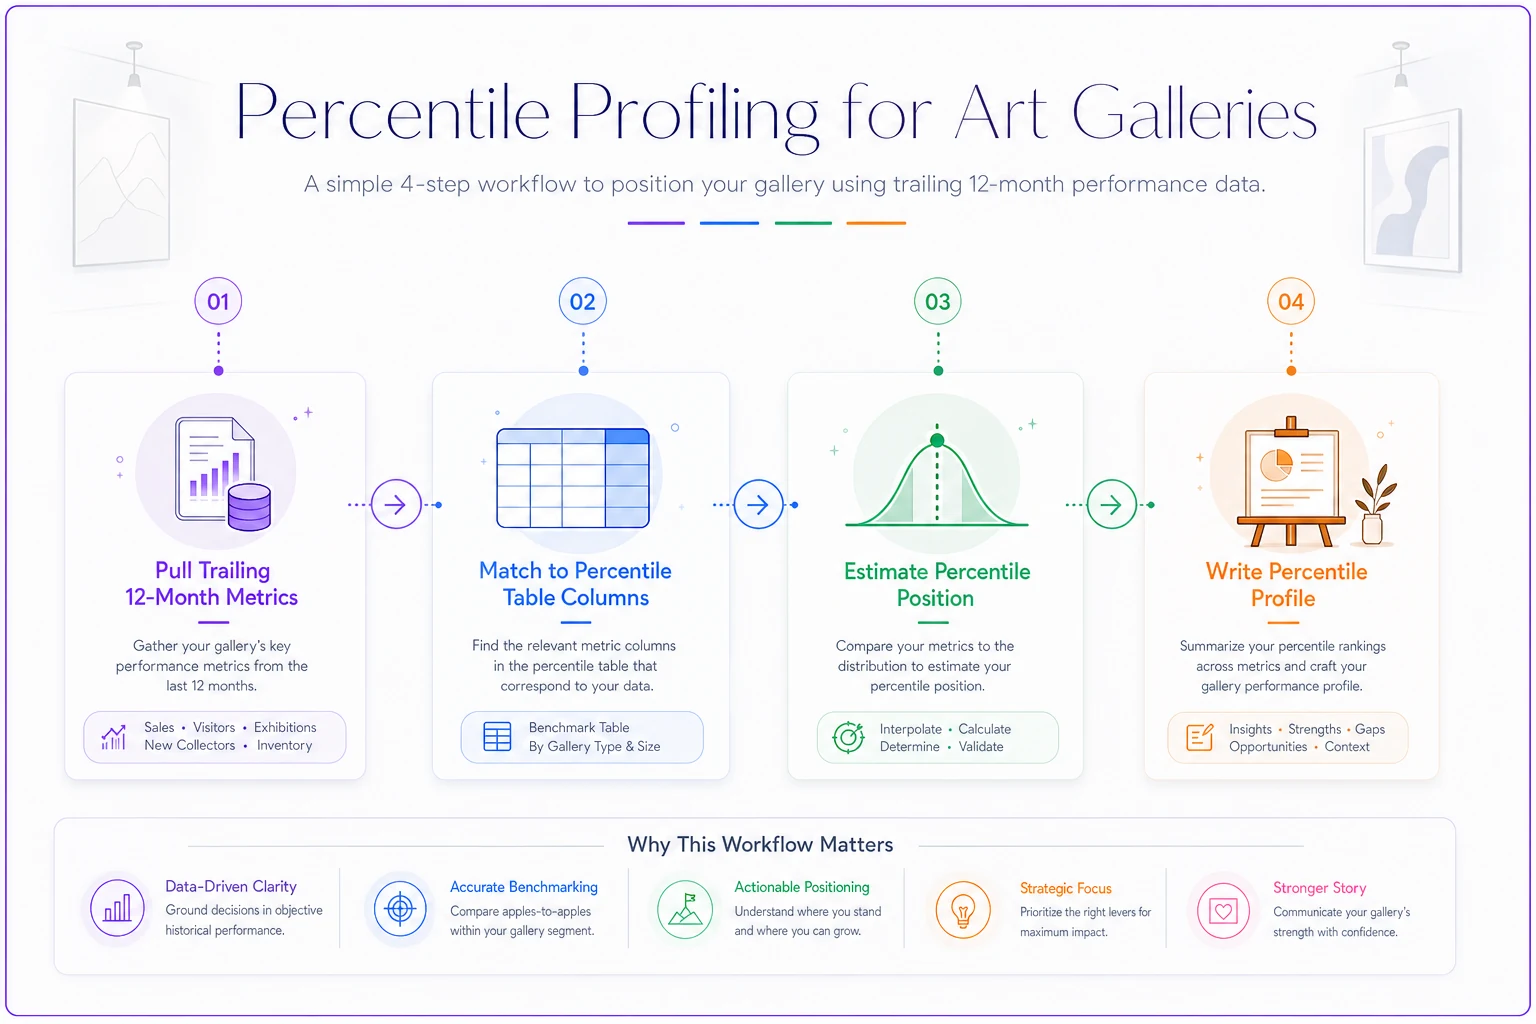
A quick visual of the placement steps.
The profile is what directs your next move — not shiny new tools or vanity metrics.
Decision rules: setting targets by staff size and revenue mix
This is where most benchmarking stops being useful. "Aim for the 75th percentile" is lazy advice. A one-person gallery and a six-person gallery should chase completely different targets, and so should a gallery living on primary sales versus one leaning on art fairs or secondary market.
Rule 1 — Staff size sets your ceiling on days-to-sale and FTE revenue. With 1–2 people, you physically cannot run the follow-up cadence that gets days-to-sale into the top quartile. Don't target the 90th percentile; target one band above your current position. A solo operator at the 40th percentile should aim for the 50th–60th next year, not the 90th. Chasing a number your headcount can't support just burns you out and degrades the client experience.
Rule 2 — Revenue mix sets your realistic sell-through. A gallery weighted toward emerging/primary work will run lower sell-through than one doing a lot of secondary or blue-chip resale. If more than roughly 60% of your revenue is primary-market emerging work, benchmark yourself against the lower half of the sell-through table and focus instead on revenue-per-artist and margin. Comparing your emerging program's sell-through to a secondary-market gallery's is apples to engine parts.
Rule 3 — Fix negative show margin before chasing any growth metric. If your show contribution margin sits at or below the 25th percentile (negative), nothing else matters. A 50% sell-through on a show that loses money just helps you lose money faster. This rule overrides everything.
Rule 4 — Pick exactly one metric to move per cycle. Small teams can't move six metrics at once. Choose the one where you're furthest below median and that your structure can actually influence. One metric, one planning cycle (usually two to three shows), then reassess.
Rule 5 — Repeat-collector share is the leverage metric for under-$500k galleries. Below a certain scale, acquiring new collectors is brutally expensive relative to deepening existing ones. If you're small and below the 50th percentile on repeat share, that's almost always your highest-ROI target — regardless of what the other numbers say.
A quick decision table for which target to chase first
The right target depends more on your current shape than on ambition. Two galleries doing identical revenue can need completely opposite strategies. The table below maps your situation to a logical starting point.
| Your situation | Benchmark against | First target to move |
|---|---|---|
| 1–2 staff, mostly primary/emerging | Lower half of table | Revenue per artist |
| 1–2 staff, mixed primary + secondary | Full table | Repeat-collector share |
| 3–4 staff, primary-focused | Median as baseline | Sell-through + margin |
| 3–6 staff, secondary/resale heavy | Upper half | Days-to-sale |
| Any size, negative show margin | Ignore percentiles | Show contribution margin |
It's worth sitting with this for a minute before moving on. A lot of gallery owners come into benchmarking with a target already in mind and use the data to confirm it. This table is meant to disrupt that — your structure should dictate your priority, not the other way around.
A real scenario: reading the profile correctly
A three-person gallery, program split roughly 70% primary / 30% secondary, annual sales somewhere around $600k–$700k. The owner felt stuck and assumed the problem was foot traffic and marketing reach.
-
Sell-through
~29% → ~55th percentile (fine)
-
Revenue per artist
~$18k → ~45th percentile (slightly low)
-
Repeat-collector share
~24% → ~30th percentile (weak)
-
Days-to-sale
~145 → ~45th percentile (okay for their mix)
-
Revenue per FTE
~$220k → ~65th percentile (good)
-
Show margin
~9% → just under median
Nothing screamed crisis. But the repeat-collector share at the 30th percentile, combined with decent per-FTE productivity, pointed to a specific problem: they were winning sales but not re-winning buyers. New faces every show, almost no second purchases.
Instead of spending on reach, they spent one cycle on retention — structured follow-up after every sale, a short stewardship cadence, and actually logging which collectors bought what. Over the next three shows, repeat-collector share moved from roughly 24% toward the mid-30s, which lifted total revenue without a single new marketing dollar. The marketing they'd almost bought would have been wasted motion against the wrong metric.
The lesson isn't the tactic. It's that the profile told them where to look, and their gut told them the opposite.
When benchmarking is a bad idea
Skip it if your data is garbage. If you can't reliably pull trailing-12-month numbers for even four of the six core metrics, fix your record-keeping first. Benchmarking against clean peer data using dirty internal data produces confident, wrong conclusions. Clean data starts with having one place where sales, inventory, and collector history actually live together — the structural foundation covered in designing an integrated gallery performance system.
Skip it in your first 18 months. A new gallery's numbers are too volatile to benchmark meaningfully. One show distorts everything. Wait until you have at least four to six shows of history.
Be careful if your program is genuinely unusual. If you're a hyper-niche gallery — say, exclusively large-scale installation work with one or two sales a year at high values — standard percentile tables don't describe you. Your "days-to-sale" and "sell-through" live on a different scale entirely, and forcing them into a general table will just mislead you.
Keeping the toolkit alive instead of letting it die in a spreadsheet
The failure mode isn't building the benchmark. It's abandoning it. Galleries run the exercise once, feel a jolt of clarity, then never update it, and within a year it's a stale tab nobody opens.
What keeps it useful is a light cadence. Recalculate your six metrics once per quarter — it takes under an hour if your records are organized. Re-place yourself on the table. Check whether the one metric you chose last cycle actually moved. That's the entire loop.
Recalculate your six metrics quarterly and focus on one metric per cycle to ensure meaningful progress.
The galleries that get real mileage out of benchmarking treat it like a recurring checkup, not a one-time audit. They're not chasing the 90th percentile on everything — most of them never will, and most of them shouldn't. They're using the percentile position to decide, each cycle, which single lever is worth pulling next. That discipline — one metric, matched to your structure, checked against real peers — is what separates the galleries that compound over five years from the ones that run in place feeling busy.
Your numbers were never the problem. Reading them without context was.
Your numbers were never the problem. Reading them without context was.
Ready to elevate your gallery operations?
Join 500+ galleries using Artioly to streamline operations, boost visitor engagement, and increase art sales.