



Most galleries can tell you whether a single show sold well. Far fewer can tell you why a two-year arc of programming moved the needle — which curatorial bets built the collector base, which ones burned staff time for nothing, and which ones quietly paid off eighteen months later when a visitor from a group show finally bought from a solo booth at a fair.
That gap is the whole problem. A gallery is a portfolio. Each exhibition is a position you took. But almost nobody measures the portfolio — they measure the positions, one at a time, and forget the context by the time the next season rolls around.
This piece is about building a measurement layer that survives across seasons. Not another sales report. A way to map curatorial decisions to the KPIs they were supposed to influence, attribute outcomes to the right decisions using cohort logic, and give curators a review rhythm that actually changes what they program next.
Why single-show reporting quietly lies to you
Judging a show by its own sales punishes the ones that do the long work and rewards the ones that happened to catch a buyer mid-cycle.
A typical example looks like this. You run an emerging-artist group show in spring. It sells two small works, barely covers costs, and on the P&L it looks like a dud. But that show pulled in roughly 40 new names onto your list, three of whom start attending openings regularly. Fourteen months later, one of them buys a $28k painting from a completely different artist. If your reporting stops at "did this show sell," you just miscategorized one of your best acquisition engines as a failure.
The reverse happens too. A blue-chip-adjacent solo show sells out fast and looks like genius programming. But dig in and most of those buyers were existing collectors who would've bought something from you that quarter anyway. The show didn't expand anything — it just harvested demand you already had. Great for cash flow, misleading as a signal about what to program next.
Single-show reporting can't see any of this because it has no concept of attribution over time and no concept of where a buyer came from. Those two ideas — cohorts and attribution — are the backbone of curatorial portfolio measurement for a gallery that wants to program deliberately instead of reactively.
Start with decision→KPI mapping, not with dashboards
The mistake galleries make when they get serious about measurement is jumping straight to a dashboard. They wire up sales, visitor counts, email opens, and press mentions, then stare at it waiting for insight. It never comes, because the numbers aren't tied to any decision anyone actually made.
Never miss a key exhibition detail again.
Artioly helps you organize, promote, and manage every exhibition effortlessly.
- Unified exhibition scheduling
- Artist and visitor notifications
- Inventory and sales tracking
No credit card required
Flip the order. Before a season starts, write down the actual curatorial decisions you're making and what each one is supposed to move. This is the decision→KPI map, and it's the step most galleries skip entirely.
A decision isn't "we're doing a summer group show." A decision is "we're using the summer slot to test whether photography collectors cross over to our painting program." That sentence tells you exactly what to measure: how many photography-cohort names attend, how many engage with painting-tagged works afterward, and whether any convert within the following two seasons.
| Curatorial decision | Primary KPI | Secondary KPIs | Attribution window |
|---|---|---|---|
| Emerging group show to grow top-of-funnel | New qualified names added | Opening attendance, repeat visits | 18–24 months |
| Solo show of under-collected artist | Sell-through of that artist | Price realization vs. estimate, waitlist growth | 1 season |
| Cross-genre show to test crossover | % of cohort engaging new genre | Downstream cross-genre purchases | 2–3 seasons |
| Institutional-tone show for credibility | Press quality + museum/curator visits | Loan requests, consignment inquiries | 2–4 seasons |
| Fair booth tied to a gallery show | Fair-attributed sales | New collectors meeting known artists | 6–12 months |
Notice the attribution windows are different. That's deliberate. A credibility play and a cash-flow play should never be judged on the same timeline, and when you force them onto the same quarterly report, you end up killing the slow-burn shows that matter most.
If you've already read our piece on treating curation as a hypothesis with its own metrics and feedback loops, this is the structural layer that sits on top of it. The hypothesis tells you what you're testing. The decision→KPI map tells you how you'll know it worked, and over what horizon.
Cohort attribution: the method that actually fits how galleries sell
Galleries don't sell like e-commerce. A buyer doesn't click an ad and convert the same afternoon. They enter your orbit through one show, marinate through three more, and buy from a fifth. So last-touch attribution — crediting the sale entirely to the show where the purchase happened — is almost always wrong for a gallery.
Cohort attribution handles this better. Instead of asking "which show sold this," you ask "which show introduced this buyer, and what have they done since?" You group buyers and prospects by their entry point — the first exhibition, fair, or event that got them onto your qualified list — and then track that whole cohort forward through time.
Here's what a simplified entry cohort table looks like after a few seasons. Each row is the group of names that first engaged at that show; the columns show what that cohort did afterward.
| Entry cohort (first engagement) | Names added | Attended 2+ later shows | First purchase within 24mo | Total revenue attributed to cohort |
|---|---|---|---|---|
| Spring '23 emerging group | ~45 | 11 | 6 | ~$61k |
| Fall '23 solo (established) | ~18 | 4 | 9 | ~$112k |
| Spring '24 cross-genre | ~33 | 14 | 5 | ~$74k |
| Summer '24 photo show | ~27 | 6 | 3 | ~$22k |
Read this carefully, because it tells a story the P&L can't. The Fall '23 solo added few names but converted a high share — it's a harvesting show, good for cash, weak for growth. The Spring '23 group added the most names and produced real downstream revenue despite looking soft at the time. The Summer '24 photo show looks like the weakest performer so far, but it's also the youngest cohort — its 24-month window isn't closed, so judging it now would repeat the exact mistake we're trying to avoid.
Three attribution methods, and when each one is honest
-
First-touch (entry attribution). Credit the show that introduced the buyer. Best for evaluating acquisition and top-of-funnel programming. Use this to defend the group shows and risky bets that never sell much themselves.
-
Linear/weighted multi-touch. Spread credit across every show a buyer engaged with before purchasing, weighted toward the more recent ones. Best for understanding nurture — which shows keep people warm. Harder to compute by hand, which is exactly where a system earns its keep.
-
Last-touch (purchase attribution). Credit the show where the sale closed. Only honest for pure harvesting decisions and fair booths, where the point genuinely was to close. Dangerous as a default.
A practical rule that holds up: use first-touch to decide what to keep programming, and last-touch to decide what to put next to high-intent buyers. Mixing those up is how galleries end up over-indexing on safe, sellable shows and slowly starving their own pipeline.
What breaks when you try to do this across many seasons
Everything above is manageable for two shows. The system starts breaking the moment you're tracking five cohorts across three seasons with overlapping buyers, inconsistent name entry, and a curator who remembers the spring show differently than the spreadsheet does.
-
Identity drift. The same collector enters as "J. Alvarez" at one opening and "Jorge A." on a fair lead sheet. Now your cohorts double-count and your attribution is quietly garbage.
-
Tagging inconsistency. Shows get categorized loosely. One season "cross-genre" means photo-into-painting; the next it means something else entirely. Your cohort table ends up comparing things that aren't comparable.
-
Window amnesia. A show gets written off at the quarterly review before its attribution window closes, and the slow-burn data never gets revisited.
-
Lost context. By the time a cohort matures, nobody remembers what the original curatorial hypothesis even was, so the result can't be interpreted properly.
-
Spreadsheet decay. The person who built the tracking sheet leaves or gets too busy, and the whole thing freezes mid-season.
Most of these aren't analytical failures. They're data hygiene and continuity failures — the same class of problem that shows up whenever a small team tries to carry structured information across time without something holding the shape for them. The analysis is the easy part. Keeping clean, consistent, de-duplicated records across years is the part that quietly kills the effort.
This is where a proper performance layer matters more than any single report. If you're building toward this, our walkthrough on designing an integrated gallery performance system with a canonical data model and KPI hierarchy covers the underlying structure — one definition of a "collector," one definition of a "show type," one place names live. Portfolio attribution is only as trustworthy as that canonical layer underneath it. Garbage cohorts in, confident-looking garbage out.
Building the multi-season dashboard
A multi-season dashboard is not a bigger version of your sales report. It's a different object. Its job is to let a curator look at two-plus years of programming and see patterns, not totals.
A dashboard that actually gets used tends to have four views:
The portfolio view. Every show plotted on two axes — one for acquisition (new qualified names) and one for realized value (attributed revenue to date). This immediately separates your harvesters from your builders from your genuine misses.
The cohort maturation view. Each entry cohort shown across its timeline, so you can see conversion accumulating. The key design choice here is showing window status — flagging which cohorts are still open so nobody judges them prematurely.
The crossover view. For cross-genre or audience-expansion bets specifically, a simple flow showing how many names moved from engaging one program to engaging another. This is the only way to measure whether an expansion decision actually expanded anything.
The decision ledger. The unglamorous but essential view: every curatorial decision, its original hypothesis, its mapped KPI, its window, and its current status. This is what prevents window amnesia and lost context.
The feeder data for all of this comes from visitor behavior, engagement, and purchase history — which is why the groundwork laid in turning visitor flow into curation decisions with low-cost analytics pays off here. Visitor-level signals are what let you populate cohorts with more than just buyers, so you can see engagement moving before it becomes revenue.
Flag cohorts as 'open' or 'closed' in the dashboard so reviewers know which windows are still active.
Here's a simple workflow diagram showing how raw visitor and sales data move through cohort attribution into the dashboard views and the review cadence.
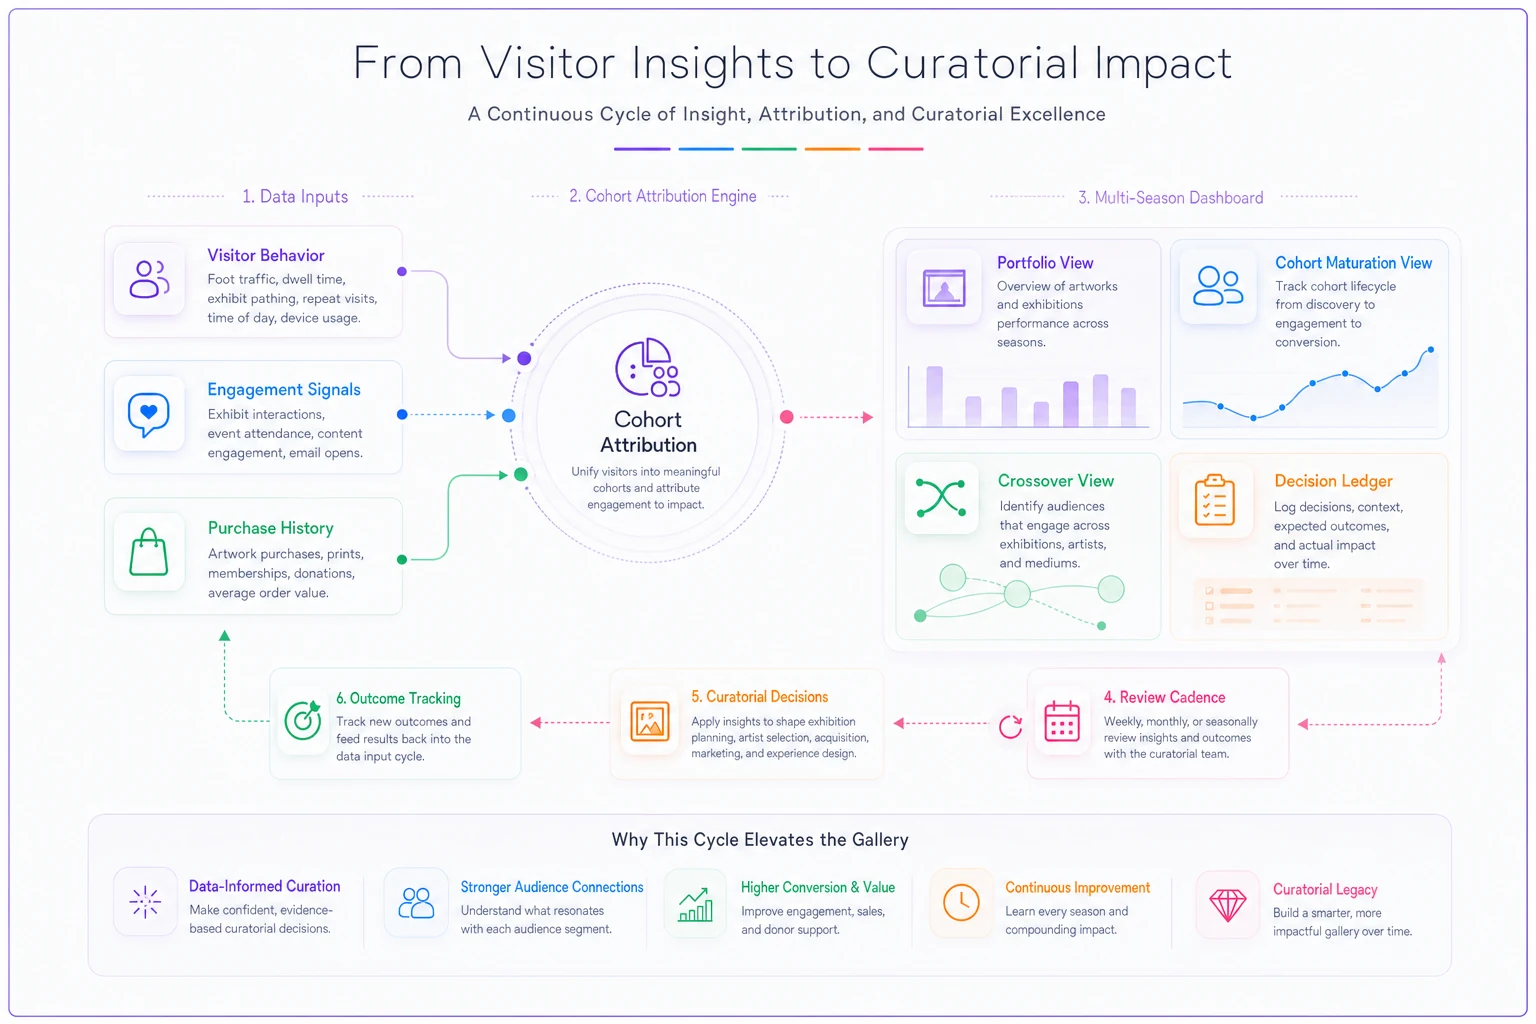
The diagram emphasizes the flow from raw data to cohorts to dashboard views and then into scheduled reviews that drive programming decisions.
The curator review cadence
A dashboard nobody reviews on a schedule is just a nicer graveyard. The cadence is what turns measurement into programming decisions. A layered rhythm tends to work best — different horizons for different questions.
-
Post-show debrief (within 2 weeks of close). Capture the raw numbers and, critically, re-state the original hypothesis and whether the show felt like it did what it was meant to. Keep it short, factual, unemotional. Resist the urge to declare victory or defeat yet.
-
Seasonal portfolio review (end of each season). Look at the portfolio view. Rebalance the next season — are you over-weighted toward harvesting shows? Starving the pipeline? This is where decisions get adjusted.
-
Cohort maturation review (quarterly). Revisit open cohorts. Update attribution. Specifically hunt for the slow-burn conversions that single-show reporting missed. This is the meeting that saves the misjudged group shows.
-
Annual programming audit. Step all the way back. Which types of decisions have consistently paid off? What's your real acquisition-to-harvest ratio? What should the next year's portfolio deliberately rebalance toward?
The discipline that matters most: at the seasonal review, you are not allowed to retire a show type based only on its own sales. You have to look at its cohort's downstream behavior first. That single rule prevents the most common and most expensive curatorial measurement mistake — cutting the programming that builds your future audience because it didn't pay for itself in the room on opening night.
A real scenario
A mid-sized commercial gallery, two owners and three staff, running roughly 7–8 shows a year. Profitable but drifting toward safe, sellable solo shows because those were the ones that looked good on the quarterly numbers. The group and experimental shows kept getting squeezed.
They spent one quiet summer doing the unglamorous work: cleaning up their list to eliminate duplicate collector records, tagging the last two years of shows consistently, and building entry cohorts for each. First-touch attribution on the cleaned data showed that roughly 60% of their new qualified collectors over those two years had entered through exactly the experimental and group shows they'd been planning to cut. Several of those names had gone on to make larger purchases later, from solo shows that had been getting all the credit.
They didn't overhaul everything. They rebalanced — protecting two "builder" slots per year explicitly measured on acquisition and a 24-month window, keeping the harvesting shows but no longer letting them define the whole program. New qualified names added grew meaningfully over the following year, and the quarterly arguments about "why are we doing this unsellable show" mostly stopped, because the dashboard answered the question before anyone had to.
The point of that story isn't the numbers. It's that nothing about their taste or their artists changed. What changed was their ability to see the portfolio, which changed what they were willing to keep programming.
When this is worth it — and when it isn't
When it makes sense: you're running enough shows per year that patterns exist to find, you sell to collectors who buy over time rather than one-off walk-in sales, and you've got at least one person willing to own the data hygiene. Galleries building a deliberate multi-year program get the most out of this.
When it's a bad idea: if you're doing one or two shows a year, this is overkill — you can hold the whole picture in your head, and the overhead will cost more than it returns. Build the habit of clean records now, but skip the full attribution apparatus until your volume justifies it.
Who should not do this: anyone whose underlying data is a mess and who isn't willing to fix it first. Attribution on dirty, duplicate-ridden records doesn't just fail — it produces confident, wrong conclusions that are worse than having no dashboard at all. Fix identity and tagging first. The measurement is useless without it.
The shift this really represents
Curatorial portfolio measurement isn't about turning taste into a spreadsheet or letting numbers pick your artists. It's about giving curatorial judgment a memory that survives across seasons — so the long bets get credit for the audiences they build, the cash-flow shows get seen for what they are, and nobody has to re-litigate the same programming arguments every quarter from scratch.
The galleries that do this well don't measure more. They measure across time, attribute honestly, and protect the review cadence that turns all of it back into better programming. Do that, and the portfolio stops being a series of disconnected gambles and starts behaving like something you're actually steering.
Curatorial portfolio measurement isn't about turning taste into a spreadsheet or letting numbers pick your artists. It's about giving curatorial judgment a memory that survives across seasons — so the long bets get credit for the audiences they build, the cash-flow shows get seen for what they are, and nobody has to re-litigate the same programming arguments every quarter from scratch.
Ready to elevate your gallery operations?
Join 500+ galleries using Artioly to streamline operations, boost visitor engagement, and increase art sales.